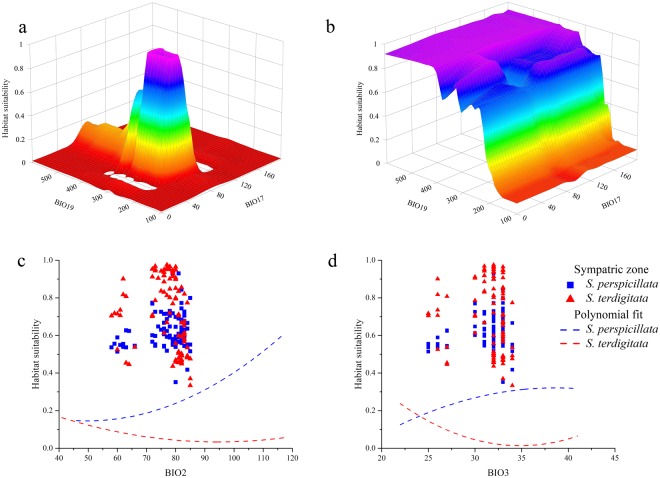
Figure 2.
Response plots of climate influence. (a) 3-D plot of Habitat suitability as a function of the pairwise interaction between BIO17 (precipitation of the driest quarter) and BIO19 (precipitation of the coldest quarter) for Salamandrina terdigitata. (b) 3-D plot of Habitat suitability as a function of the pairwise interaction between BIO17 (precipitation of the driest quarter) and BIO19 (precipitation of the coldest quarter) for Salamandrina perspicillata. (c) Marginal response curves for S. perspicillata (blue) and S. terdigitata (red) of BIO2 (mean diurnal range); in blue squares and red triangles, the Habitat suitability as a function of BIO2 sampled in the sympatric zone. (d) Marginal response curves for S. perspicillata (blue) and S. terdigitata (red) of BIO3 (isothermality); in blue squares and red triangles, the Habitat suitability as a function of BIO3 sampled in the sympatric zone.

