
Figure EV1. Patient Neuroimaging.
-
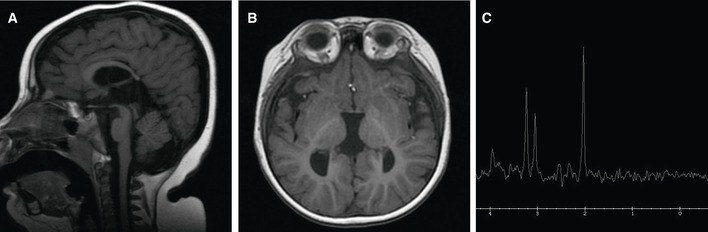
ASagittal T1‐weighted FSE showing thinning of the posterior part of the corpus callosum with agenesis of the splenium. Prominent subcutaneous fat deposition can also be seen.
-
BAxial T1 FSPGR reveals that the third ventricle is bigger and the ventricular atrium has a parallel orientation, due to agenesis of the splenium.
-
CMRS of the patient's brain shows a normal spectroscopy pattern.