
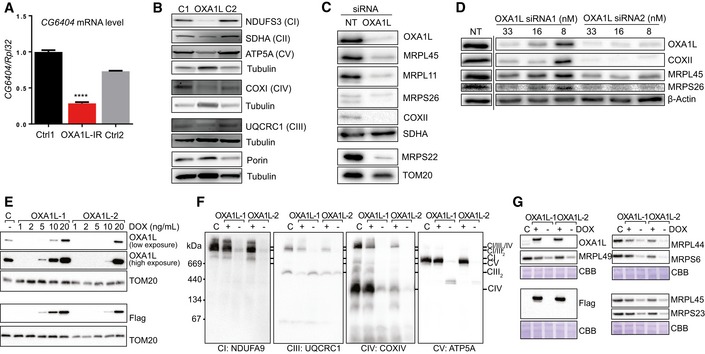
Figure 3. Analysis of OXA1L depletion in D. Melanogaster and human cells with siRNA and CRISPR/Cas9.
-
ACG6404 mRNA level in control (black and grey) and OXA1L siRNA‐treated flies (red) normalised to RpL32 mRNA with control 1 (black) set to 1. Four biological replicates per group. One‐way ANOVA with Tukey's multiple comparison test. Error bars represent standard error of the mean (SEM). **** denotes P < 0.0001.
-
BWestern blot analysis of OXPHOS complex subunits in fly homogenates from control (Ctrl 1, Ctrl 2) and CG6404 siRNA‐depleted (OXA1L‐IR) flies. Three biological replicates per group. One‐way ANOVA with Tukey's multiple comparison test.
-
CRepresentative figure of Western blot analysis performed on cell lysate (≈30 μg) after 6 days of incubation with either NT‐siRNA or OXA1L SmartPool siRNA. The steady‐state level of OXA1L and of components of the mt‐LSU (MRPL45, MRPL11) and mt‐SSU (MRPS26, MRPS22) were evaluated, as well as the steady‐state level of the mtDNA‐encoded protein COXII. SDHA and TOM20 antibodies were used as loading controls.
-
DWestern blot analysis was performed on cell lysate (≈30 μg). The efficiency of the depletion was assessed with antibodies targeting OXA1L. Steady‐state levels of the mt‐encoded protein COXII as well as mitoribosomal proteins MRPL45 and MRPS26 were also visualised. The equality of the loading was controlled using antibodies targeting β‐actin. The figures are representative of two biological repeats. The dashed line indicates that some lanes were omitted from the figure.
-
ETwo independent cell lines (OXA1L‐1 and OXA1L‐2) were grown in different concentrations of doxycycline (DOX) to modulate OXA1LFLAG expression. Mitochondria were isolated and compared with control mitochondrial from wild‐type HEK293T cells (labelled C) by SDS–PAGE and immunoblotting with antibodies against OXA1L, FLAG epitope and TOM20 (as control).
-
FMitochondria were isolated from cells treated with or without 10 ng/ml DOX for 5 days. Samples were solubilised in digitonin before BN‐PAGE analysis of supercomplex forms of respiratory complex I (NDUFA9), complex III (UQCRC1), complex IV (COXIV) and complex V (ATP5A) by immunoblotting.
-
GRibosomal subunits were analysed by SDS–PAGE and immunoblotting. Blots stained with Coomassie brilliant blue (CBB) serve a loading controls.
Source data are available online for this figure.