
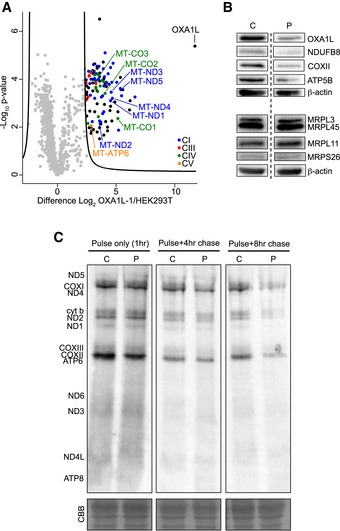
Figure 4. Identifying interacting partners of OXA1L and assessing mitochondrial protein synthesis in patient fibroblasts.
-
AAffinity purification mass spectrometry analysis of proteins interacting with OXA1L‐FLAG. Control (HEK293T) or OXA1L‐1 cells expressing OXA1L‐FLAG were solubilised in 1% (w/v) digitonin and incubated with anti‐FLAG affinity gel (n = 3). Eluates were analysed by label‐free quantitative mass spectrometry (LFQ). Log2 LFQ intensities were submitted to a modified two‐sided two‐sample t‐test with significance determined through permutation‐based false discovery rate (FDR) statistics as described in the Materials and Methods. Enriched respiratory complex subunits are colour‐coded, and mtDNA‐encoded subunits are labelled. Full data are provided in Dataset EV1.
-
BWestern blot analysis was performed from control (C) and OXA1L patient immortalised fibroblasts (P). The steady‐state level of OXA1L was assessed as were the steady‐state levels of components of the OXPHOS system (NDUFB8, COXII and ATP5β). On a separate Western blot, the levels of the mitoribosomal proteins MRPL3, MRPL45, MRPL11 and MRPS26 were detected. For both the membranes, β‐actin was used as loading control. The dashed line indicates that some lanes were omitted from the figure.
-
CControl (C1) and patient (P) fibroblasts were treated with emetine dihydrochloride to inhibit cytosolic translation and mitochondrial protein synthesis analysed by [35S] Met/Cys incorporation with 1 h pulse and either 4 or 8 h chase. Cell lysate (50 μg) was separated through a 15% polyacrylamide gel. The gel was stained with Coomassie blue (CBB) to confirm equal loading. After fixation and drying the signal was visualised using a Typhoon FLA9500 PhosphorImager. Signals were ascribed following established migration patterns (Chomyn, 1996).
Source data are available online for this figure.