
Figure EV5. GTEx Portal Expression Profiles for OXA1L Isoforms.
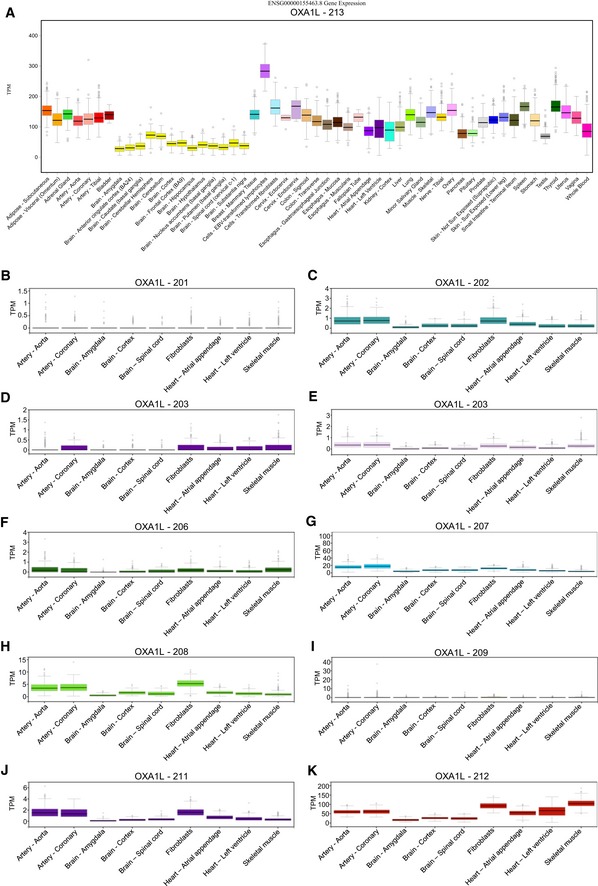
All boxplots generated using the Genotype‐Tissue Expression Project (GTEx) Analysis Release V7, individual tissue eQTL dataset available through the GTEx Portal (https://www.gtexportal.org/home/).
-
ABoxplots of expression levels in transcripts per million (TPM) for OXA1L‐213, the main protein coding isoform of OXA1L, across the full available tissue panel. Box plots are shown as median and 25th and 75th percentiles; points are displayed as outliers if they are above or below 1.5 times the interquartile range.
-
B–KExpression levels in TPM for isoforms OXA1L‐201 through 212, respectively, across a reduced panel of tissues. The reduced tissue panel includes artery—aorta, artery—coronary, brain—amygdala, brain—cortex, brain—spinal cord, cells—transformed fibroblasts, heart—atrial appendage, heart—left ventricle and muscle—skeletal.