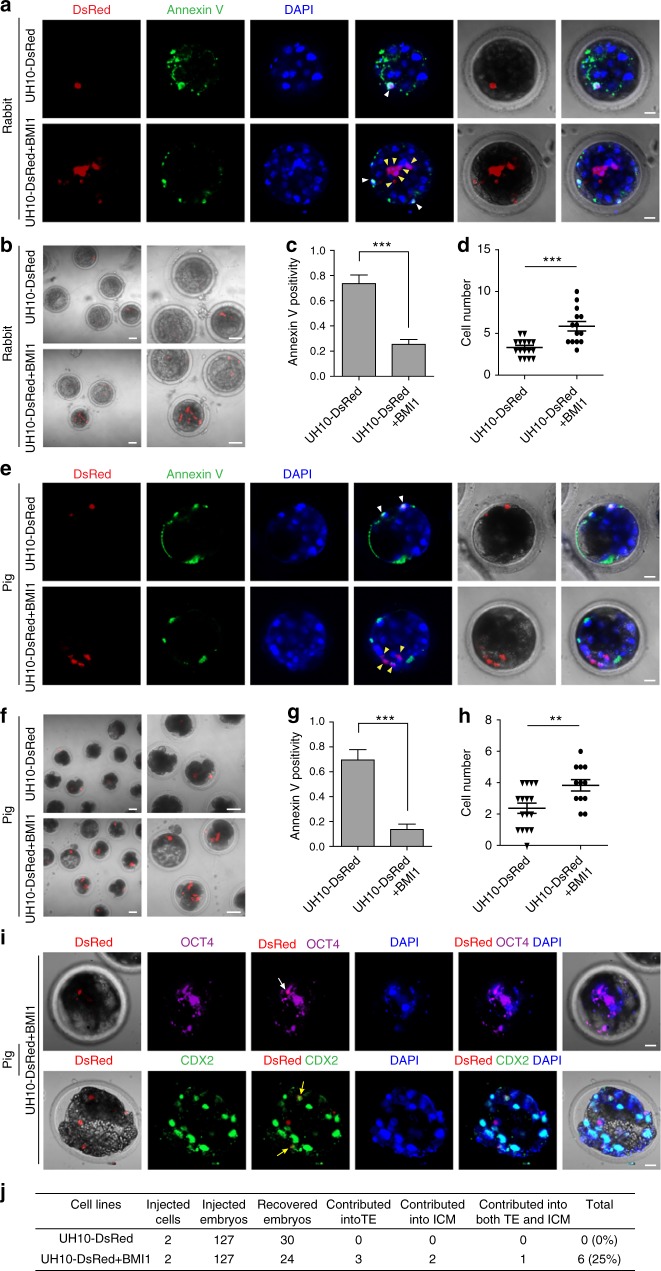
Fig. 4.
hiPSCs + BMI1 integrate into rabbit and pig preimplantation blastocyst. a−d Integration of hiPSCs + BMI1 in rabbit blastocysts. a Representative images of rabbit embryos stained with Annexin V after injection of seven indicated DsRed+ cells in blastocysts and 1-day culture in vitro. White arrow, DsRed+/Annexin V+ cells; Yellow arrow, DsRed+/Annexin V− cells. Scale bars, 20 µm. b Images of rabbit blastocysts injected with seven indicated cells after 1-day culture in vitro, scale bars, 50 µm (left), 20 µm (right). c Statistics of the percentage of engrafted DsRed+ cells that were Annexin V+ in the injected rabbit blastocysts; mean + SEM of 16 (UH10-DsRed) or 14 (UH10-DsRed + BMI1) samples, ***p < 0.001. d Statistics of the DsRed+ cells in the injected rabbit blastocysts; mean ± SEM of 16 (UH10-DsRed) or 14 (UH10-DsRed + BMI1) samples, ***p < 0.001. e−h Integration of hiPSCs + BMI1 in pig blastocysts. e Representative images of pig embryos stained with Annexin V after injection of 3–5 indicated DsRed+ cells in later morulas or early blastocysts for 1-day culture in vitro. White arrow, DsRed+/Annexin V+ cells; Yellow arrow, DsRed+/Annexin V− cells. Scale bars, 20 µm. f Images of pig blastocysts injected with the indicated cells after in vitro culture. Scale bars, 50 µm (left), 20 µm (right). g Statistics of the percentage of engrafted DsRed+ cells with Annexin V+ in injected pig blastocysts; mean + SEM of 16 (UH10-DsRed) or 12 (UH10-DsRed + BMI1) samples, ***p < 0.001. h Statistics of the number of DsRed+ cells injected in pig blastocysts; mean ± SEM of 16 (UH10-DsRed) or 12 (UH10-DsRed + BMI1) samples, **p < 0.01. i Representative images of pig blastocyst injected with UH10-DsRed + BMI1 stained with antibodies against the indicated markers. Two indicated DsRed+ cells were injected to 8C stage pig embryos. The integrated UH10-DsRed+ with BMI1 expression coexpress OCT4 or CDX2 in cultured chimeric embryos after additional 4 days’ culture in vitro. White arrow, DsRed+/OCT4+ cells; yellow arrow, DsRed+/CDX2+ cells. Scale bars, 20 µm. j Summary of chimera assays injected with the indicated DsRed+ cells at the 8C stage pig embryo, and the injected embryos were cultured for additional 4 days to blastocysts

