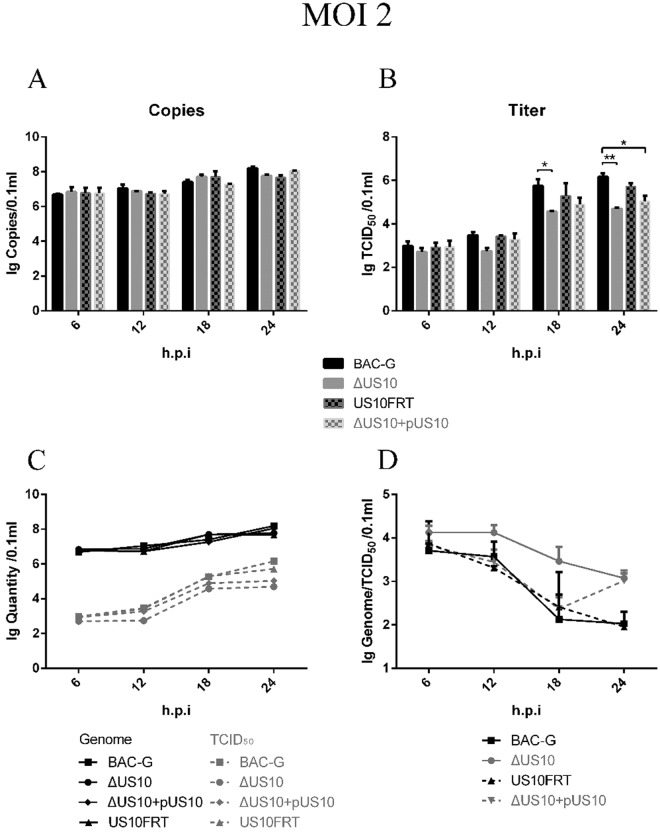
Figure 4.
Viral titer and genome copies in one-step growth kinetics. Confluent DEF cells monolayers were infected with each virus shown at an MOI of 2. Viral titer and viral copies of infected cells were determined at the indicated time points by measuring TCID50 on DEF cells. All titrations were carried out in three independent experiment. The titers and copies obtained were averaged, and the standard error of the mean was calculated each time point. (A) Viral copies. (B) Viral titer. (C) Viral copies and titer. (D) Genome/TCID50 ratios.

