-
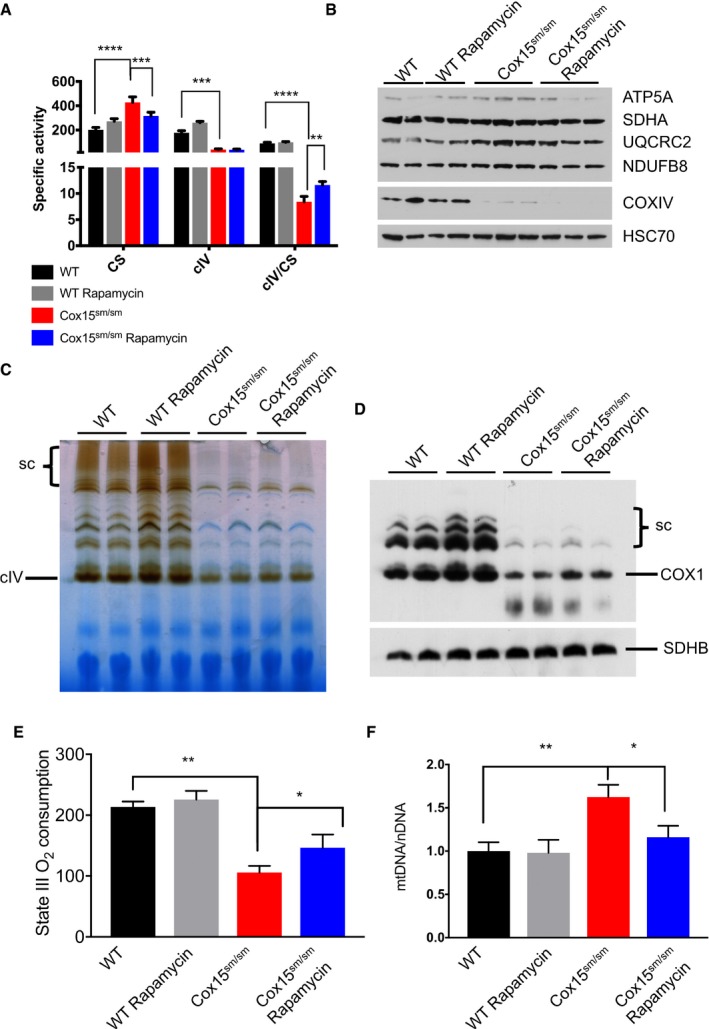
A
Spectrophotometric activities of the respiratory chain (n = 4–5/group). CS: citrate synthase; cIV: complex IV. Black: untreated WT; gray: rapamycin‐treated WT; red: untreated Cox15
sm/sm; blue: rapamycin‐treated Cox15
sm/sm. Error bars represent SEM. The asterisks represent the significance levels calculated by two‐way ANOVA with Tukey’s correction: ****P < 0.0001 (CS: WT versus Cox15
sm/sm), ***P = 0.0010 (CS: Cox15
sm/sm versus Cox15
sm/sm rapamycin), ***P = 0.005 (cIV: Cox15
sm/sm versus WT), ****P < 0.0001 (cIV/CS: WT versus Cox15
sm/sm), **P = 0.0060 (cIV/CS: Cox15
sm/sm rapamycin versus Cox15
sm/sm).
-
B
Western blot immunovisualization of subunits of the respiratory complexes. Note the increased protein levels in Cox15
sm/sm versus WT samples, which are reduced to normal levels upon rapamycin treatment. Additional samples were run on a separate gel (not shown).
-
C
BNGE in‐gel activity for cIV. Sc: supercomplexes. Note that the COX reaction is slightly increased in rapamycin‐treated versus untreated Cox15
sm/sm samples.
-
D
Immunoblot of 1D‐BNGE using an anti‐cIV antibody (COX1). Note that COX amount is slightly increased in rapamycin‐treated versus untreated Cox15
sm/sm muscles. SDHB was used as a loading control.
-
E
State III (succinate‐driven) oxygen consumption (n = 3/group). Error bars represent SEM. The asterisks represent the significance levels calculated by unpaired, two‐tailed Student's t‐test: **P = 0.0016 (WT versus Cox15
sm/sm); *P = 0.047 (Cox15
sm/sm versus Cox15
sm/sm+rapamycin).
-
F
Analysis of mtDNA amount (n = 9/group). Error bars represent SEM. The asterisks represent the significance levels calculated by one‐way ANOVA with Tukey's correction: **P = 0.0020; *P = 0.0296.