
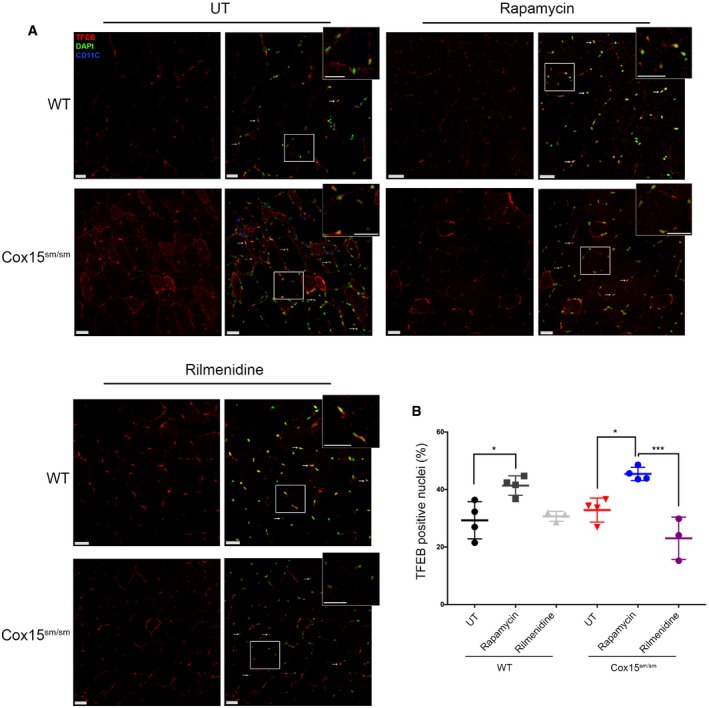
Figure 6. Rapamycin, but not rilmenidine, induces TFEB translocation to the nucleus.
-
AAnti‐TFEB immunofluorescence on rapamycin‐ and rilmenidine‐treated WT and Cox15 sm/sm muscles versus untreated (UT) samples. CD11C (blue signal) indicates inflammatory cells. The scale bars correspond to 30 μm.
-
BQuantification of the TFEB‐positive nuclei (n = 3/group). Quantification was performed using Imaris spots surface excluding the CD11C‐positive nuclei. Error bars represent SEM. The asterisks represent the significance levels calculated by one‐way ANOVA with Tukey's post hoc multiple comparison test: *P = 0.0199 (WT versus WT+rapamycin), *P = 0.0150 (Cox15 sm/sm versus Cox15 sm/sm+rapamycin), ***P = 0.0001.