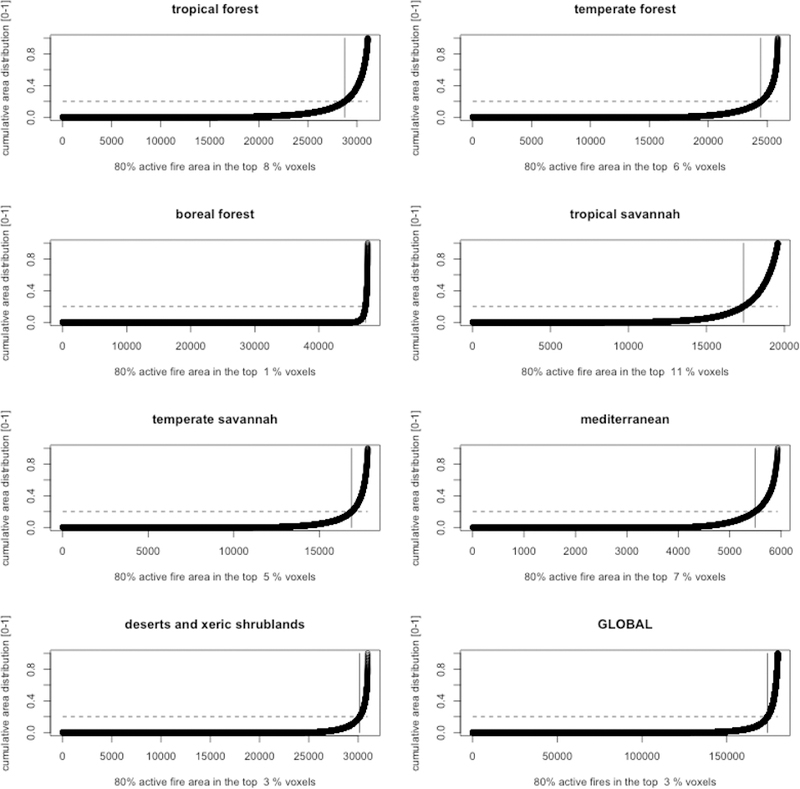
Figure 3:

Cumulative distribution of the active fire area globally and for the seven biomes for 2008. The x axis shows the number of voxels sorted in ascending order by active fire area and the y axis shows the normalized cumulative active fire area. The active fire areas are calculated using the 2008 MODIS active fire detections (Section 3.3). The vertical line indicates the 20th quantile of the active fire area cumulative distibution; 80% of the active fire area is detected in just 1% to 11% of the voxels, depending on the biome.
