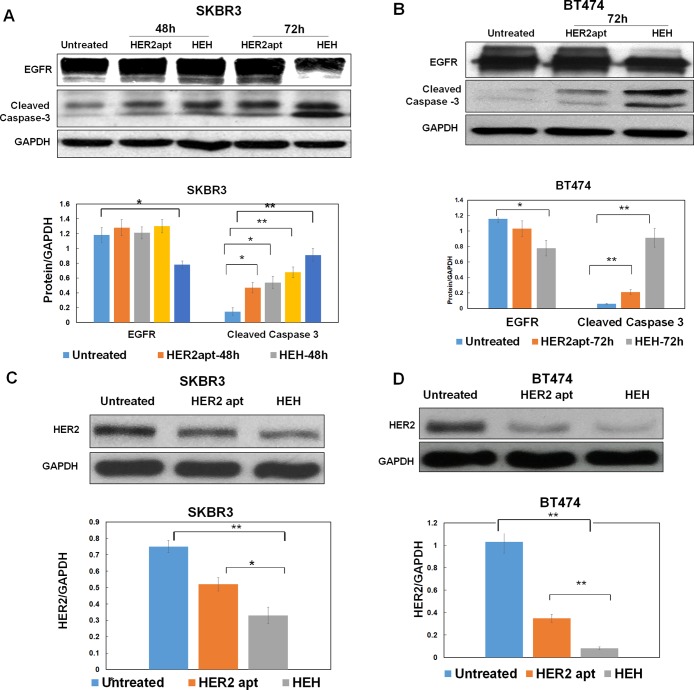
Figure 4.
Evaluation of protein levels by Western blot. (A) Detection of EGFR and Cleaved Caspase 3 in SKBR3 cells after treatment with HER2 aptamer and HEH for 48 h and 72 h. (B) Detection of EGFR and Cleaved Caspase 3 inBT474 cells after treament with HEH and HER2 aptamer for 72 h. (C) Detection of HER2 in SKBR3 cells after treatment with HER2 aptamer and HEH for 72 h (D) Detection of HER2 in BT474 cells after treatment with HER2 aptamer and HEH for 72 h Quantification of protein levels normalized by GPDH using ImageJ. The results are the mean ± SEM from three independent experiments. ∗P < 0.05, ∗∗P < 0.01.

