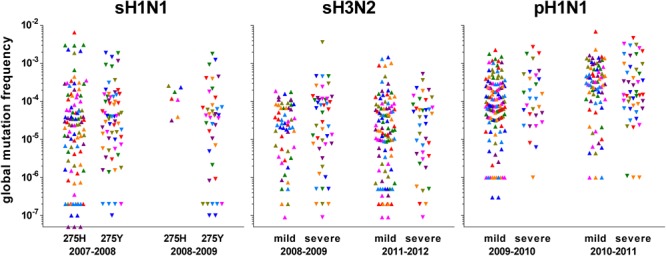
FIGURE 2.

Representation of the global mutation frequencies according to season and group of interest. Values were calculated from the data obtained with LoFreq at a 0.005 threshold. Each symbol represents one segment of one sample: polymerase sub-unit PB2: olive; polymerase sub-unit PB1: green; polymerase sub-unit PA: purple; hemagglutinin HA: red; nucleoprotein NP: dark blue; neuraminidase NA: pink; matrix and ion channel proteins M: orange; non-structural protein and nuclear export protein NS: light blue. For pre-pandemic sH1N1 viruses, groups were based on the oseltamivir-resistance mutation H275Y (275H: sensitive; 275Y: resistant) in the neuraminidase; for both H3N2 and pandemic pH1N1 viruses, groups were based on the severity according to the network of sampling (mild through community physicians, severe through hospitals).
