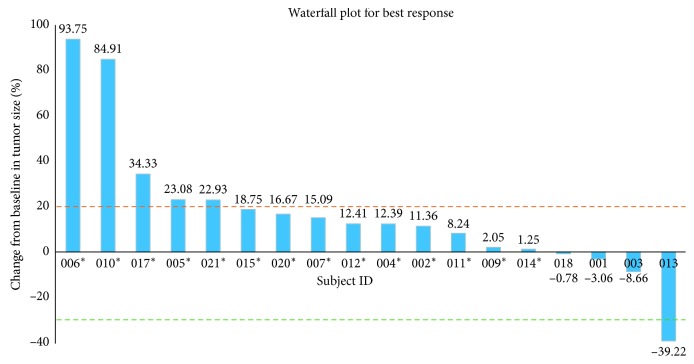
Figure 1.
Waterfall plot for best response. The subject IDs with “∗” are those with progressive disease in the study. “PR” means partial response. The dotted lines indicate a 30% reduction and 20% increase from baseline, which are the cutoff points that determine partial response and progressive disease, respectively. The value for each vertical bar is added.

