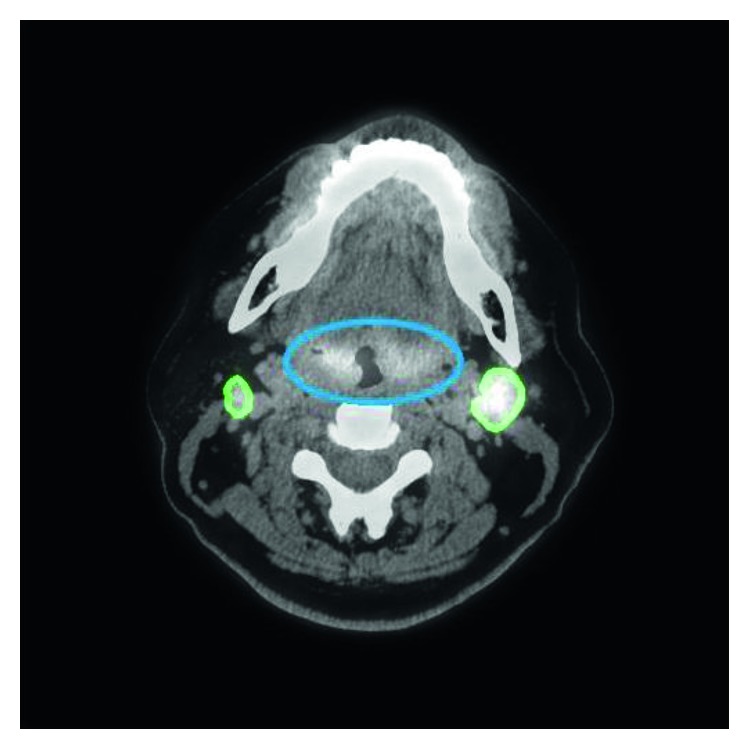
Figure 5.

An example of inflammation. The inflammation region, which is marked by a blue line, looks similar to the tumor and so may be difficult to distinguish by visual assessment. However, it was recognized correctly by our proposed method (green line). The dice similarity coefficient (DSC) of this tumor was 0.848.
