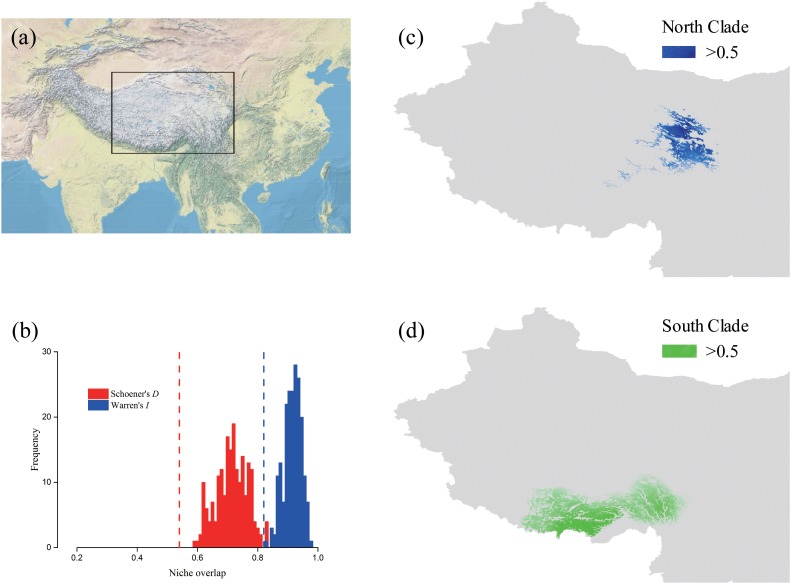
FIGURE 8.
Potential distributions and niche overlap for L. tibetica lineages in the QTP. (a) The location illustration of the simulation area. (b) Vertical lines represent the empirical value of Warren’s I and Schoener’s D indices, obtained from observed points; the histograms represent the expected distribution of overlap; the null hypothesis of identical niches is rejected if the empirical value falls outside the 95% probability threshold of the expected distributions (P < 0.05). The potential distributions for L. tibetica in the North lineage (c) and South lineage (d).

