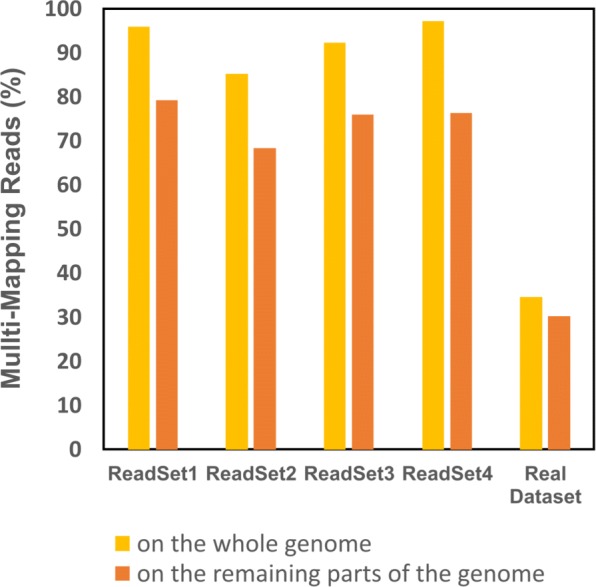
Fig. 7.

Multi-mapping reads on the whole and the remaining parts of the genome. A real and four simulated datasets were used. The orange and yellow bars show the percentage of multi-mapping reads where the reads were aligned against the whole genome, and in which the reads were mapped onto the regions not covered by the contigs of the first step of EIM, respectively
