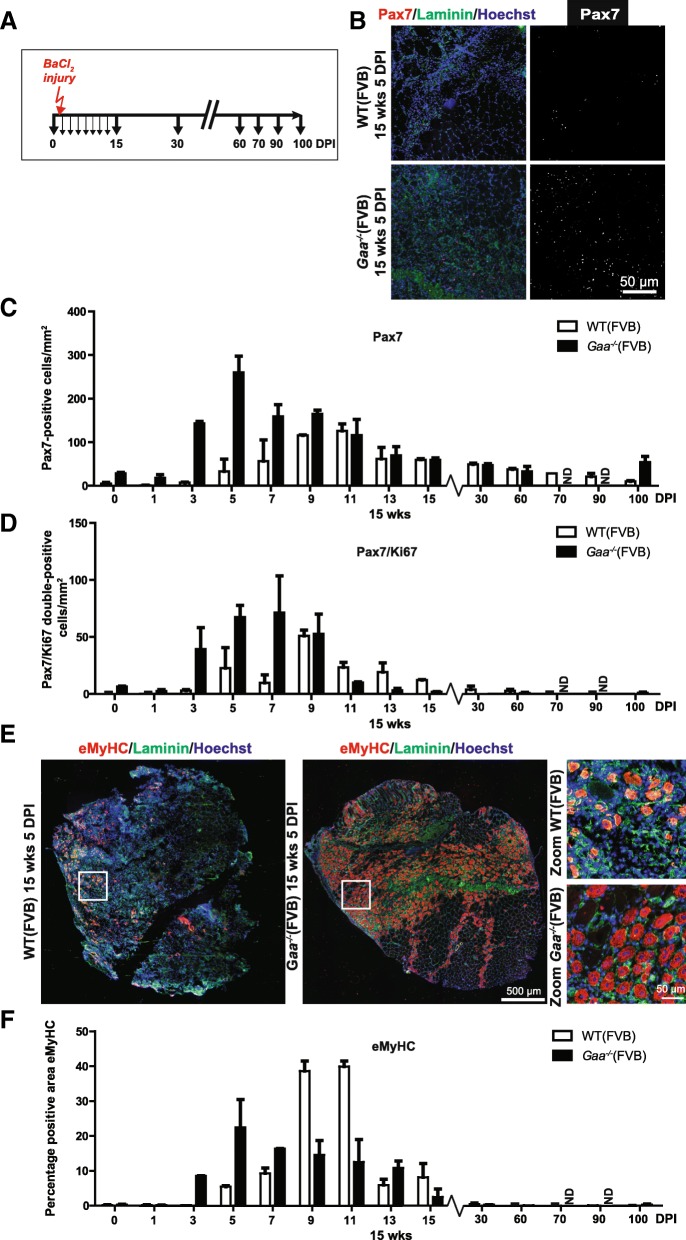
Fig. 5.
Rapid satellite cell response in Gaa−/− mice after experimental injury. a. Experimental schedule. Black arrows indicate the time at which TA muscles were collected for analysis, the red arrow indicates the time of injury. b. pax7 expression. Immunofluorescent (IF) staining of TA sections using a Pax7 antibody (in red). Representative images are shown. The basal lamina was stained using a Laminin antibody (in green). Nuclei were stained with Hoechst (in blue). Black and white images of Pax7 staining are included for better visualization. c. Quantification of the number of Pax7-positive cells/mm2 from B. Data are means ± SD from at least 2 muscles from 2 different animals. d. As C, but now for the number of Pax7/Ki67 double-positive cells/mm2. e. eMyHC expression at 5 DPI. Immunofluorescent staining using a MyHC antibody (in red). Representative images are shown. The basal lamina was stained using a Laminin antibody (in green). Nuclei were stained with Hoechst (in blue). Zooms of selected areas (white squares) are shown on the right. f. Quantification of the eMyHC-positive area in TA sections. Data are means ± SD from at least 2 muscles derived from 2 different animals

