
Figure 5.
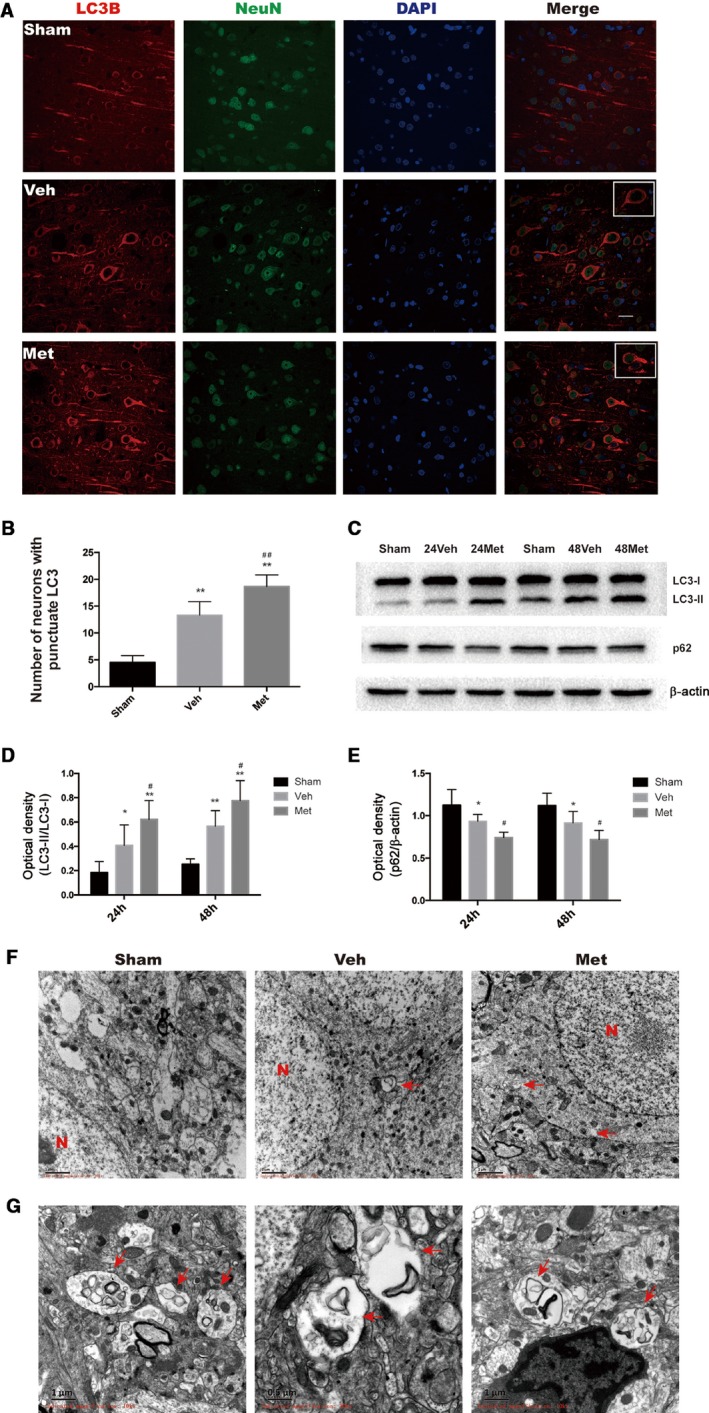
Metformin (Met) enhances autophagy activation induced by cardiac arrest and cardiopulmonary resuscitation (CA/CPR). A, Representative Microtubule‐associated protein 1 light chain 3 (LC3)/Neuron (NeuN)/4′,6‐diamidino‐2‐phenylindole (DAPI) photomicrographs of the cortex in different groups. Met increased LC3‐II immunofluorescence‐positive neurons. Scale bar: 20 μm. B, Quantitative analysis showing that Met increased the number of NeuN‐positive cells expressing LC3‐II punctuate staining. C, Representative photographs of Western blot analysis showing the expression of LC3‐II and p62 in the hippocampal tissue at 24 and 48 hours after CA/CPR. D and E, Quantitative analysis showing that Met further increased the LC3‐II/LC3‐I ratio and decreased the expression of p62. F, Representative electron micrographs showing autophagic vacuoles in hippocampal brain tissue. G, High magnification of electron micrographs showing structures of autophagosomes. The red arrows point to autophagosomes. *P<0.05, **P<0.01 vs sham group; # P<0.05, ## P<0.01 vs vehicle (Veh)–treated group.