Figure 8.

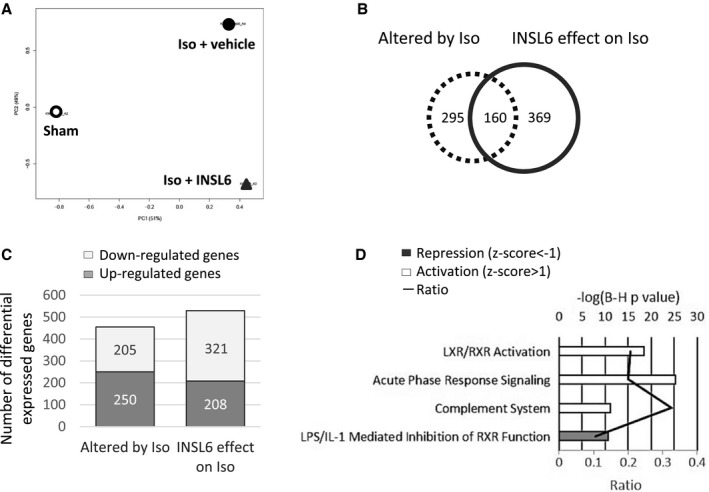
Global gene expression analysis for hearts from C57BL6/N mice treated with or without recombinant insulin‐like peptide 6 (INSL6) protein in isoproterenol (Iso) model. Three heart samples were pooled and profiled by Affymetrix Mouse Gene 2.0ST array. A, Principle component analysis of global gene expression in hearts from saline‐injected mice (Sham, open circle), Iso‐injected and vehicle‐administrated mice (Iso+vehicle, filled circle), and Iso‐injected and recombinant INSL6 protein–administrated mice (Iso+INSL6, triangle). B, Venn diagram depicts the number of differentially expressed genes that were altered by Iso injection (dotted circle, comparison between Sham and Iso+vehicle group) alone, by recombinant INSL6 protein administration (solid line circle, comparison between Iso+vehicle and Iso+INSL6 group) alone, or by both (overlapped area between dotted and solid line circle). Differentially expressed genes were defined as a fold change >1.5‐fold between 2 groups. C, Histogram depicts the number of upregulated and downregulated genes with fold change >1.5‐fold. D, Top 4 enriched canonical signaling pathways in genes differentially expressed by INSL6 protein on Iso‐treated heart. A multiple‐testing corrected P value was calculated using the Benjamini‐Hochberg method to control the rate of false discoveries. The ratio value represents the number of molecules that belong to the Ingenuity pathway analysis database‐defined pathway. Z score predicts activation or repression of pathway. IL‐1 indicates interleukin‐1; LPS, lipopolysaccharide; LXR, liver X receptor; and RXR, retinoid X receptor.
