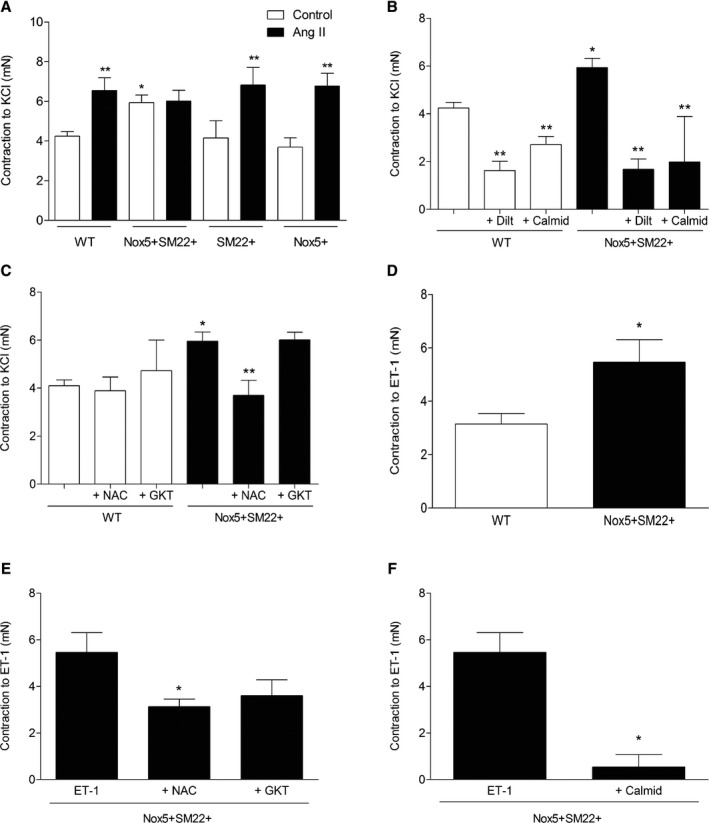
Figure 4.

Maximum contraction to KCl and ET‐1–induced contraction are increased in arteries from Nox5+/SM22+ mice. A, Vascular contraction to a single concentration of KCl (62.5 mmol/L) in mesenteric arteries from WT, Nox5+/SM22+, SM22+, and Nox5+ mice, before and after treatment with Ang II. B, Vascular contraction to KCl in mesenteric arteries from WT and Nox5+/SM22+ mice, before and after preincubation (1 hour) with diltiazem (10 μmol/L) or calmidazolium (10 μmol/L). C, Vascular contraction to KCl in mesenteric arteries from WT and Nox5+/SM22+ mice, before and after preincubation (1 hour) with NAC (10 μmol/L) or GKT137831 (10 μmol/L). D, Vascular contraction to a single concentration of ET‐1 (0.1 mmol/L) in mesenteric arteries from WT and Nox5+/SM22+ mice. Vascular contraction to ET‐1 in mesenteric arteries from WT and Nox5+/SM22+ mice, before and after preincubation (1 hour) with NAC (10 μmol/L) or GKT137831 (10 μmol/L; E) or calmidazolium (10 μmol/L; F). Results are mean±SEM of 3 to 8 mice/group. *P<0.05 vs WT; **P<0.05 vs untreated mice. Ang II indicates angiotensin II; ET‐1, endothelin‐1; NAC, N‐acetylcysteine; Nox5, NADPH Oxidase 5; WT, wild‐type.
