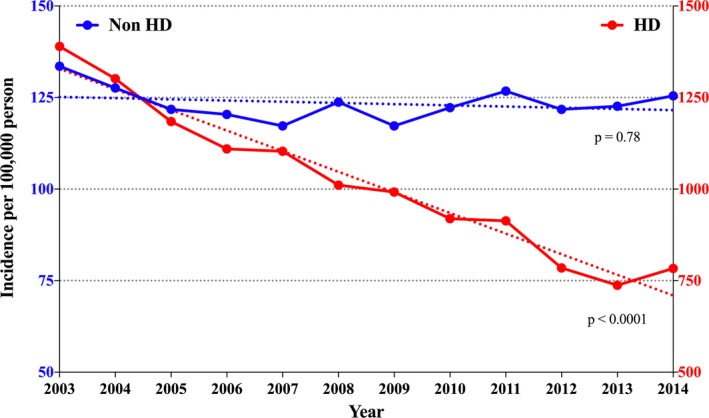
Figure 2.

Incidence of acute ischemic stroke in dialysis and non‐dialysis patients in the United States between 2003 and 2014. The x axis shows the calendar years (2003–2014). The y axis shows the incidence of acute ischemic stroke in dialysis patient on the right (red line) and in non‐dialysis patients on the left (blue line) with different scales of the y axis for the 2 populations. HD indicates hemodialysis; Non HD, non‐hemodialysis.
