Figure 1.
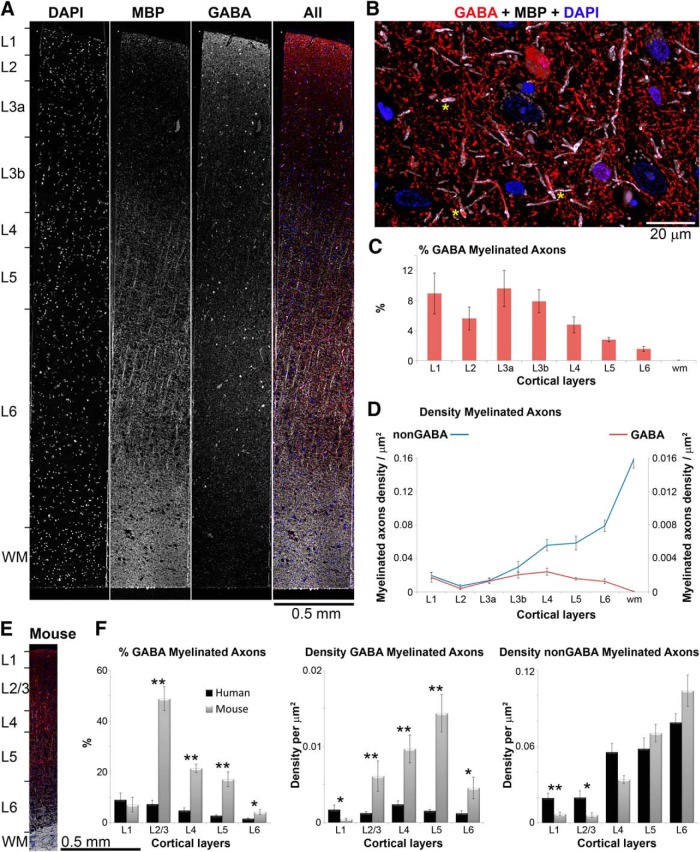
Distribution of inhibitory GABA myelinated axons in human temporal cortex. A, A 70-nm-thick section through human cortex immunostained with MBP (white) and GABA (red). Nuclei are labeled with DAPI (blue). B, Volume reconstruction of a subregion from layer 3a (35 serial sections, 70 nm each). Several GABA myelinated axons are marked with yellow asterisks. C, Proportion of myelinated axons that contain GABA in human temporal cortex. Means and SEs from eight human patients are shown. D, Density of nonGABA and GABA myelinated axonal profiles. Means and SEs from eight human patients are shown. E, A 70-nm-thick section through mouse cortex (MBP, white; GABA, red; and DAPI, blue) shown at the same scale as the human cortical section in panel A. Note the difference in cortical thickness between the two species. F, Comparison of the proportion of GABA myelinated axons and the density of myelinated axons throughout the layers of human and mouse cortex (means and SEs from eight human patients and six mice are shown). For this comparison, human results for layers 2, 3a, and 3b were pooled together to compare with mouse cortical layer 2/3. *p < 0.05, **p ≤ 0.01.

