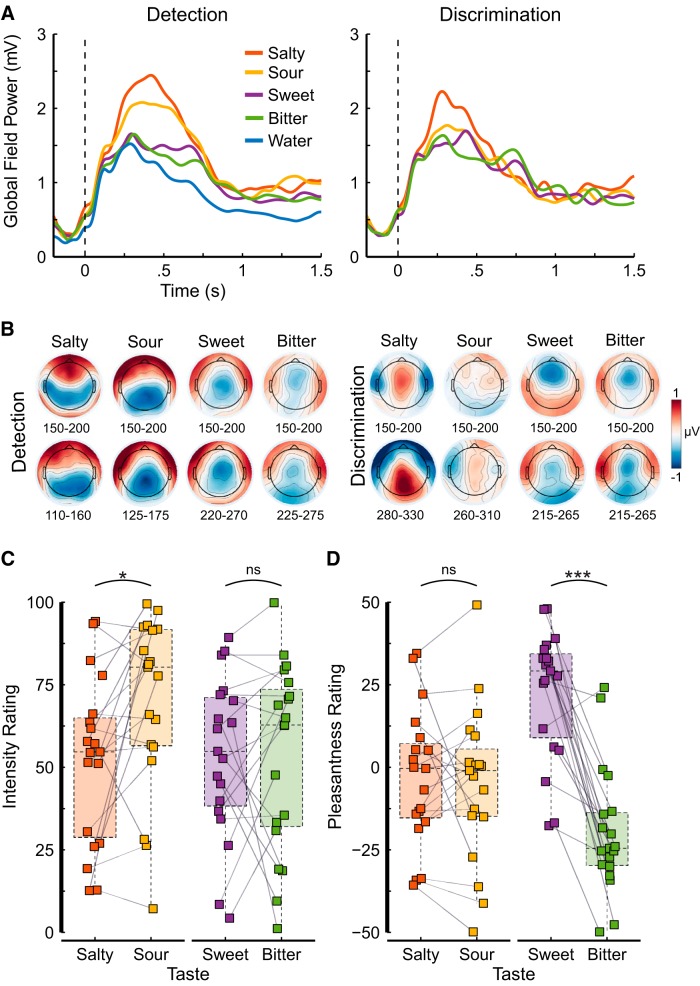
Figure 2.
A, Signal strength quantified as the average GFP computed within-subjects as the standard deviation of the event-related potentials over 64 electrodes for each of the tastants and water over detection trials (left) and discrimination trials (right). Salty and sour tastants show a stronger signal than sweet and bitter tastants, but less strongly so for discrimination trials. Note that the onset of the liquid stimulation (for all tastes and for water) coincided with the presentation of the fixation cross, resulting in a clear GFP response for water as well. B, Topographical voltage maps for each taste and task represent the grand-averaged mean over a 50-ms time window, early during processing (upper row) and surrounding the decoding onset (lower row) shown in Table 2 and Figure 3C relative to water. Intensity (0–100; C) and pleasantness ratings (-50–50; D) for the two tastant pairs, salty-sour and sweet-bitter. The colored squares show individual participant ratings, the gray lines between two squares indicate that these ratings were given by the same participant. Semitransparent and colored boxplots entail the ratings of all participants (N = 19); the horizontal dashed line within each box represents the median, the bottom and top of the box represent the first and third quartiles, respectively; whiskers show 1.5 times the interquartile range. The colors represent the taste. Significance is indicated above the plot area: ns p > 0.05; *p < 0.05; ***p < 0.001.

