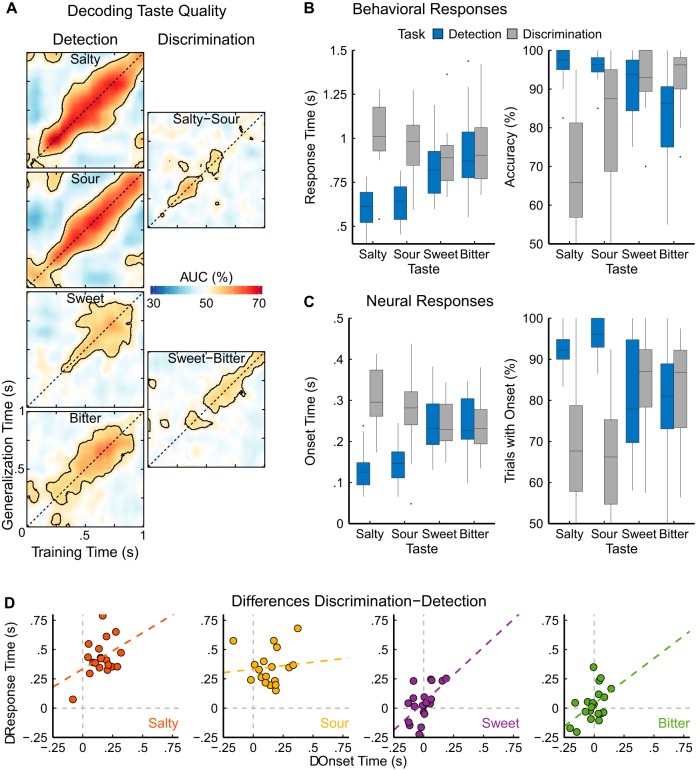
Figure 3.
A, Average within-subject decoding generalization across time for each of the four tastes by task. Detection performance is obtained for the classification of a tastant against water (detection task trials); discrimination performance is obtained for the classification between two tastants (discrimination task trials). The diagonals of the matrices (identical training and testing time) correspond to the common decoding approach. The x-axis displays training times which represents the stability of an average taste pattern. The y-axis displays generalization or testing times which represents the emergence of the average pattern (x-axis) within individual trials. Warm colors reflect average performance increases as compared to chance level (50%), cold colors reflect decreases; black contour lines indicate statistical significance of the grand average as assessed via one-sided cluster-adjusted binomial tests (p < 0.05). Salty and sour show earlier and better detection performance than sweet and bitter, whereas discrimination performance is less pronounced than detection performance in either case. B, Behavioral data of the button press RTs of correct responses and accuracy (average per participant, N = 20) color-coded for tasks (blue indicating detection trials, gray discrimination trials). The horizontal line in each boxplot represents the median, the bottom and top of the box represent the first and third quartiles, respectively; whiskers show 1.5 times the interquartile range, dots indicate outliers. Participants are faster and more accurate at detecting salty and sour than they are at discriminating the two tastants. Sweet and bitter show no difference in RTs but higher accuracy at discriminating the two as opposed to detection from water. C, Neural data of onset times of above-chance performance (determined at the single-trial level; averaged per participant; N = 20 for sweet and bitter tastes, and N = 18 for salty and sour tastes) and of the accuracy indicating the percentage of trials for which such an onset was determinable (boxplot parameters as in B). The neural findings correspond closely to the behavioral data in that salty and sour are classified faster and more accurately in detection trials. Sweet and bitter show no significant difference between the two tasks. D, Correlations of the difference values between the average discrimination and detection neural onset times and button press RTs (each point in a graph represents one participant). Color-coded dashed lines represent linear regression models; horizontal and vertical gray dashed lines indicate the points of no difference between discrimination and detection latencies on the respective axis. The observed effects were significantly positively correlated for three of four tastes, such that an early neural difference (or lack thereof) corresponded to the same behavioral effect.

