Figure 3.
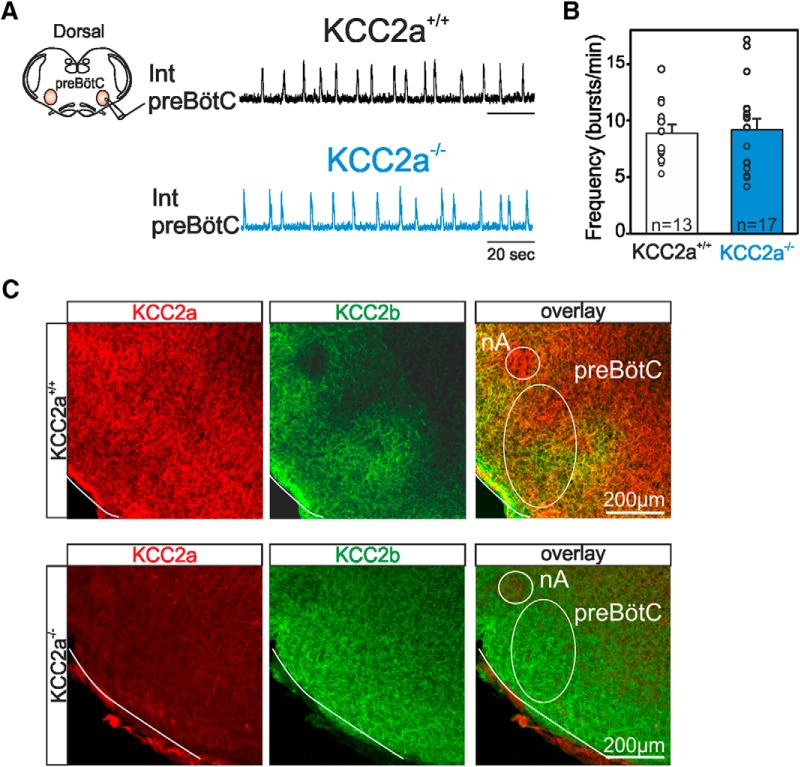
Rhythmogenesis by the isolated preBötC network is unaltered in KCC2a–/– mutants at P0. A, Left: Schematic representation of a transverse brainstem slice preparation isolating the preBötC network (in orange) with the recording macroelectrode positioned on the slice surface to monitor spontaneous preBötC network activity. Right: Integrated recording traces of preBötC activity in a preparation obtained from a KCC2a+/+ (black trace) and a KCC2a–/– (blue trace) newborn mouse at P0. Note the absence of fictive inspiratory pauses in the mutant. B, Histograms representing individual mean frequency values (open circles) and the corresponding mean (± SEM) values for preBötC network activity measured in KCC2a+/+ (n = 13; unfilled bar) and KCC2a–/– (n = 17; blue bar) preparations. The inspiratory burst frequencies expressed by the preBötC network are comparable in the two genotypes. C, Immunostainings against KCC2a (red) and KCC2b (green) in transverse brainstem slices obtained from a P0 KCC2a+/+ (top) and KCC2a–/– (bottom) animal at the axial level of the preBötC. Note the coexpression of both isoforms in the WT and the complete absence of KCC2a in the mutant (the slight background labeling is substantially below the positive labeling obtained in preparations from wild-type animals and thus does not correspond to any significant immunoreactivity).

