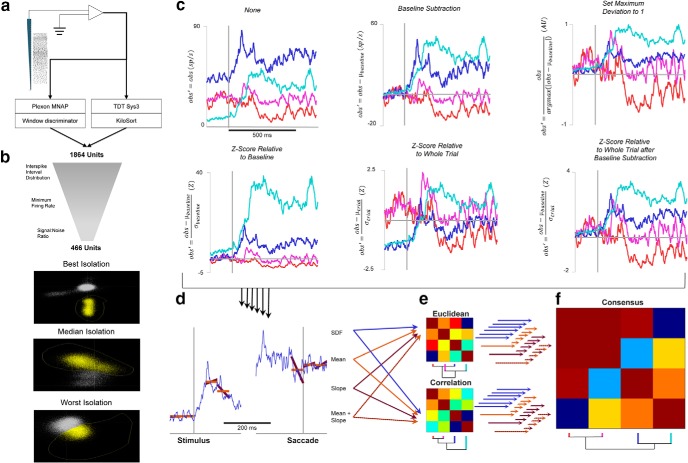
Figure 1.
Analysis pipeline. a, Potential neurons were recorded from FEF using multicontact electrode arrays. These recordings were performed either in the Plexon MNAP or the Tucker-Davis Technologies System 3. Potential units from the Plexon MNAP were sorted on-line with a window discriminator, whereas potential units from TDT Sys3 were sorted off-line using KiloSort (Pachitariu et al., 2016). A total of 1884 potential units were recorded. b, The 1884 potential units were subjected to several criteria to ensure that only single units were analyzed further. These criteria include interspike interval distributions, a minimum baseline firing rate, and a signal-to-noise ratio of sorted action potential waveforms. The quality of isolation is illustrated, where the PCA space of off-line sorting is shown for the units with the best, median, and worst signal-to-noise ratio that still meet the criterion. c, Six methods of scaling spike density functions were applied for normalization. Four units were selected to illustrate the effects of these different scaling methods. The colors of each unit were assigned arbitrarily. The equations for each scaling method are shown on the ordinates. Zero points in scaling and time are shown in light gray. d, After each scaling method, features for inclusion in the clustering algorithm are measured. Four ways of measurement were used and are demonstrated on one of the example units from above: the full SDF (blue), the mean of the SDF during epochs of interest (orange), the slope of the SDF during epochs of interest (purple), and the combination of mean and slope. Each of these four measurements, for each of the six scaling methods, were clustered individually. e, Clustering on the feature vectors generated from the scaling and measurement techniques can be performed using either Euclidean or correlation distance. Euclidean distance measures whether pairs of units have similar values of the measurements, regardless of the patterns of modulation, whereas correlation distance measures the similarity of modulation patterns regardless of absolute similarity. An example clustering dendrogram and distance matrix for each distance metric is shown as applied to the four example units, and it can be seen that these two clustering methods produce different categorizations. f, Because there is no a priori way to select which scaling method, measurement, or distance metric is most appropriate, and each may produce different categorizations, the final categorization was selected by applying consensus clustering. The distance matrices for each scaling method, measurement, and distance metric (48 total combinations) were normalized and combined to create a consensus distance matrix. The same clustering algorithm was applied to this consensus distance matrix. The consensus distance matrix and corresponding final dendrogram for the four example units is shown. Final categories were determined by applying additional criteria (minimum category membership and maximum number of uncategorized neurons).

