
Figure 6.
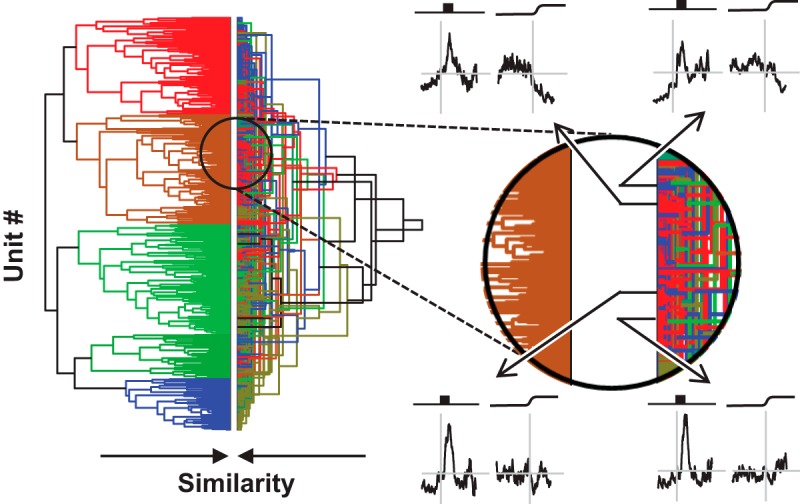
Comparison of analysis pipelines. Left: Dendrograms from cluster pipelines 2 (right) and 3 (left). They are shown side-by-side to highlight the similarities and differences in the respect categories. The dendrogram for cluster pipeline 3 is identical to the dendrogram in this figure. The dendrogram for cluster pipeline 2 shows the same results as in Figure 5; however, the vertical arrangement was reordered so that common units are horizontally aligned in both dendrograms. Where common colors are horizontally aligned, units were assigned to the same category. Where different colors are horizontally aligned, units were assigned to different categories. Although horizontal alignment of some dendrogram elements is evident, the disagreement between the two dendrograms is more prominent. The extent and nature of this disagreement is illustrated in the expanded view of the dendrogram on the right. SDFs of four representative units are shown. Through analysis of pipeline 3, all four units were placed in category 2c, which characterized by a pronounced visual response and weak perisaccadic suppression (left dendrogram). Through analysis of pipeline 2, three of the units were placed in category 6b, which is characterized by a pronounced visual response and weak perisaccadic suppression (red, right dendrogram), whereas the unit shown at the upper right was placed in category 1b, which is characterized by a weak visual response and no perisaccadic modulation (blue, right dendrogram). Thus, the two analysis pipelines provide overlapping, but far from identical, categorizations. Which categorization is correct is uncertain.