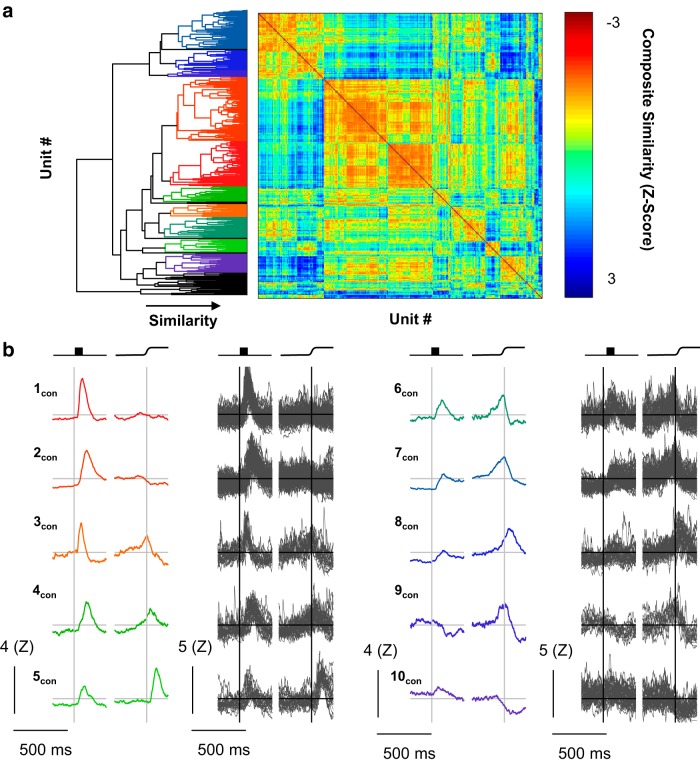
Figure 7.
Consensus clusters. Consensus clusters were identified by creating a composite distance matrix and applying the agglomerative clustering procedure to this matrix. a, The resulting dendrogram is shown abutting the composite distance matrix. Colors in the dendrogram are assigned as in Figures 3–6. Color in the distance matrix is indicative of composite similarity. Warm colors (low composite z score) indicate consistently similar units, whereas cool colors indicate consistently different units (high composite z score). b, The category mean SDFs (columns 1 and 3) and the individual SDFs (columns 2 and 4) comprising them are shown aligned on stimulus onset (left) and saccade (right). Scale bars are shown at the lower left of each column. Arbitrary category labels were assigned for convenience.

