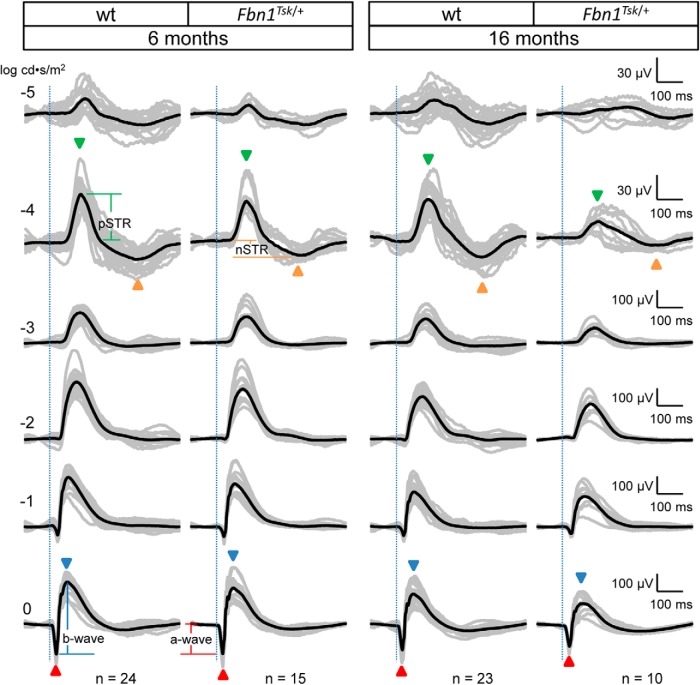
Figure 3.
Scotopic ERG waveforms from wt and Fbn1Tsk /+ mice at six and 16 months of age. Scotopic ERG waveforms (amplitude vs time) of individual mice (gray traces) and average waveforms (black traces) in response to flash intensities of -5, -4, -3, -2, -1, and 0 log cd·s/m2 are shown, with each row of waveforms resulting from the same stimulus intensity, indicated on the left side of the figure. Stimulus onset is indicated by vertical dotted lines. Representative temporal locations of the pSTR and nSTR are indicated by green and orange arrowheads, respectively, for stimulus intensity of -4 log cd·s/m2, and the a- and b-waves indicated by red and blue arrowheads, respectively, for 0 log cd·s/m2. Representative amplitude measurements for pSTR, nSTR, a-wave and b-wave responses are shown in the first and second columns at -4 and 0 log cd·s/m2. Latencies are defined as time from stimulus onset (vertical dotted lines) and peak or trough response. Vertical and horizontal scales for each row of responses are shown to the right of the figure. Genotype and age of mice is indicated at the top with number in each group indicated at the bottom of each column.

