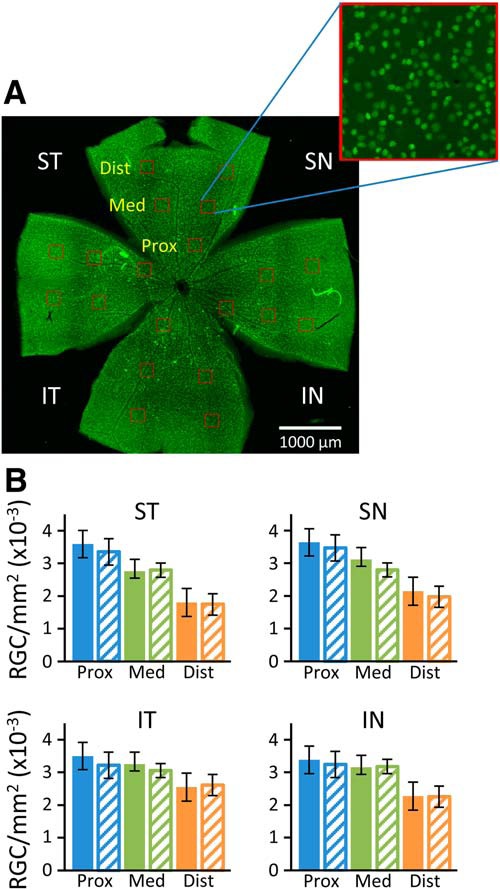
Figure 5.

RGC density in the retinas of 16-month-old mice. Retinas stained for Brn3a (green) were imaged and RGCs counted manually in 20 boxes (red) of 50 μm2 placed at 0.7, 1.4, and 2.1 mm from the optic nerve in the superior temporal (ST), superior nasal (SN), inferior temporal (IT), and inferior nasal (IN) quadrants (A). RGC densities were similar for wt (filled bars) and Fbn1Tsk /+ mice (hash-marked bars) at each location (B). Error bars are ±SD. Data represent counts from the retinas of 15 wt and nine Fbn1Tsk /+ mice.
