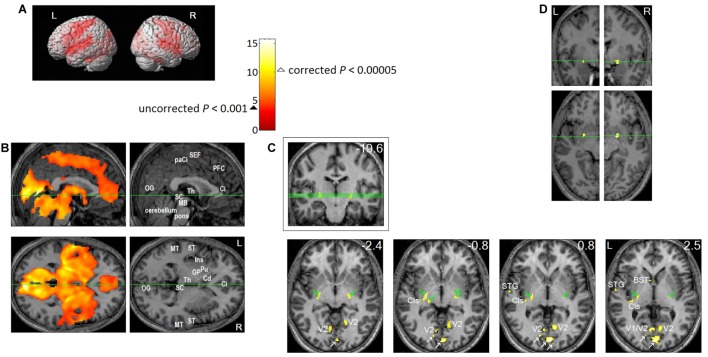
FIGURE 5.
Brain regions activated in association with REMs in sleep. Eleven healthy participants participated in the study. Each participant slept two consecutive nights in the MRI scanner from about 11 pm until they awoke in the morning. We obtained fMRI data as soon as REMs were recognized by video-monitoring, and for as long as they continued. Twenty four REM sleep scans were obtained from eleven participants. We timed REMs from video recording, then to study the neural correlates of REMs, we employed a rapid event-related Blood Oxygenation Level Dependent (BOLD) fMRI design, where each REM constituted a natural event. From the timing of REMs, we predicted the time course of fMRI signal (estimated hemodynamic changes following REMs), then identified the voxels that match this predicted time course using a general linear model. Then, we performed ‘random effects’ analysis on the results of the 24 individual scans (one sample t-test). We used SPM2 for these statistical analyses. All images were spatially normalized. (A,B) Thresholded at uncorrected P < 0.001 (T = 3.5,  ); an additional spatial extent threshold of five continguous voxels was applied. (A) Projection onto a surface rendering of a template brain. This shows activation of precentral motor cortex and postcentral somatosensory cortex time-locked to REMs. (B) Upper row shows median sagittal views, lower row axial views. Green lines show location of the other views. This shows that REM-locked activation is characteristically widespread. Ci, anterior cingulate gyrus; Cd, head of caudate nucleus; GP, globus pallidus; Ins, insula; MB, midbrain; MT, middle temporal gyrus; OG, occipital gyrus; paCi, paracingulate gyrus; PFC, medial prefrontal cortex; Pu, putamen; SC, superior colliculus; ST, superior temporal gyrus; Th, thalamus. See Figure 3 in (Hong et al., 2009) for REM-locked activation (corrected P < 0.05) of non-visual primary sensory cortices (auditory, vestibular, and olfactory), Wernicke’s and Broca’s area, fusiform gyrus and mesopontine tegmentum. (C,D) To highlight peak REM-locked activations, the threshold was raised to a high level, corrected P < 0.00005 (T = 10.1, Δ). (C) Peaks were clearly localized in striate cortex (the primary visual cortex, V1. White arrows indicate V1), V2, thalamic reticular nucleus (indicated by green arrows), claustrum (Cls, the posterior-ventral zone, i.e., the putative visual zone), superior temporal gyrus (STG), bed nucleus of stria terminalis (BST). Green lines on the coronal view inside the box (the number in mm denote distance from the AC) show locations of the serial axial views (the numbers in mm denote distance from the AC-PC plane). (D) Peaks were clearly localized to the substantia innominata, bilaterally. These clusters overlap the cholinergic basal nucleus projecting to the posterior neocortex, including visual cortex. Adapted from Hong et al. (2009) with the permission from Hong.

