
Figure 2. Neurotransmitter binding site.
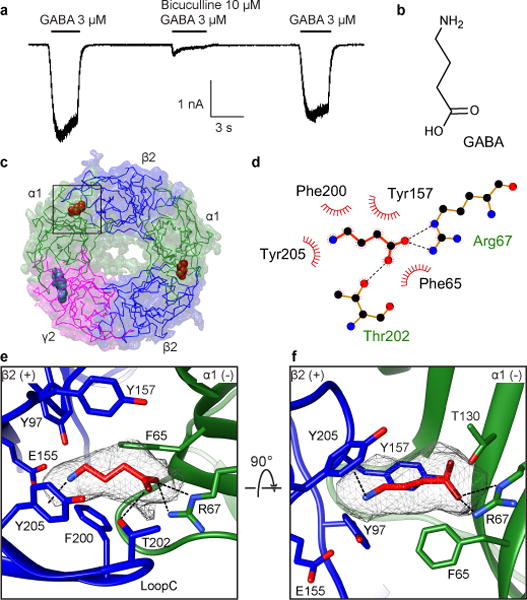
a, Electrophysiology of the GABA-A EM construct in HEK cells. n=3 independent experiments. b, GABA chemical structure. c, View from synapse; box indicates one of two equivalent GABA binding sites at β2-α1 interfaces. d, LigPlot schematic of GABA interactions showing electrostatic (dashes) and hydrophobic interactions (eyelashes). e,f, Detailed architecture of GABA binding pocket boxed in c. e, Synaptic view as in c. Putative hydrogen bonding and cation-π interactions are represented as dashed lines. f, Side view of the GABA binding pocket with loop C backbone hidden for clarity.