
Figure 5. Vestibule and non-vestibule N-glycosylation.
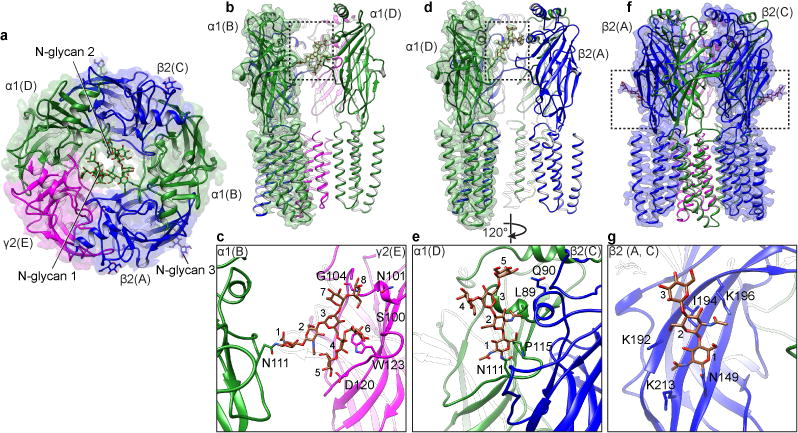
a, Synaptic view of receptor with glycosylation sites indicated. b,d, Side view of vestibule N-glycosylation attached to α1 subunits. Subunits β2 and γ2 are hidden for clarity. N-linked glycans are indicated by dashed black boxes. c,e, Detailed structures of N-linked glycans. c, NAG1-NAG2-BMA3-MAN4-MAN5-MAN6-MAN7-MAN8. e, NAG1-NAG2-BMA3-MAN4-MAN5. f,g, Reference and detailed structures of peripheral N-linked glycosylation on β2 subunits. Chain IDs are in parentheses.