
Extended Data Figure 4. Three-dimensional reconstructions of the two GABA-A receptor conformations.
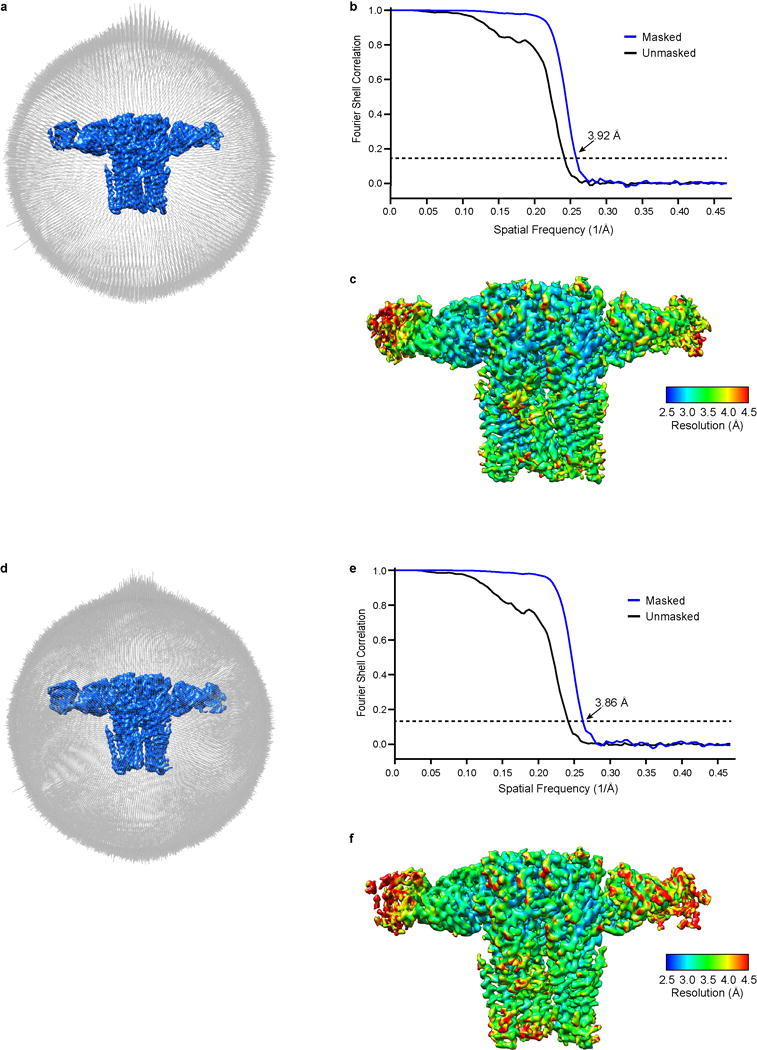
a, Angular distribution histogram of GABA-A receptor conformation A particle images. b, Fourier shell correlation (FSC) of conformation A maps before (black) and after (blue) masking. c, Local resolution of the GABA-A receptor estimated by ResMap. d-f, as in a-c but for GABA-A receptor conformation B.