
Extended Data Fig. 9. Permeation pathway and subunit interfaces.
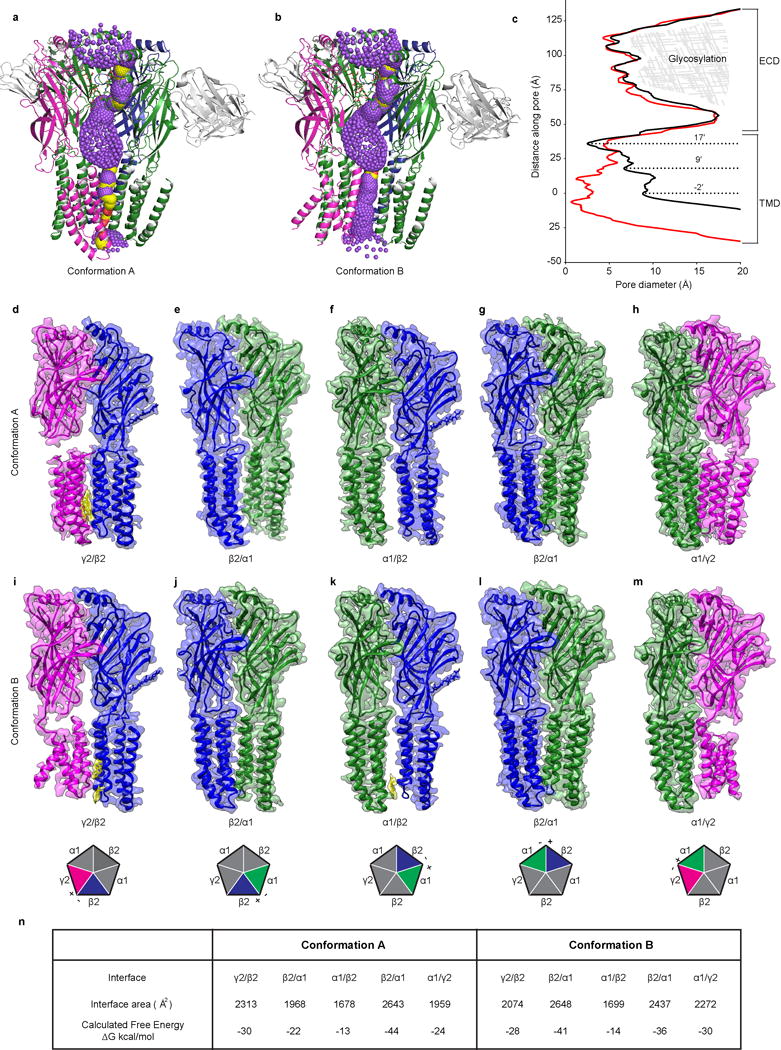
a, Cartoon of permeation pathway for conformation A. Single β2 subunit is removed for clarity. Purple spheres indicate pore diameters >5.6 Å; yellow is >2.8 Å and <5.6 Å; red is <2.8 Å. b, Same as a but for conformation B. c, Pore diameters for conformation A (red) and conformation B (black). The zero value along the y-axis of the plot is aligned with the α-carbon of the −2′ position of conformation B. d-m, Side view of two adjacent subunits in conformations A (d-h) and B (i-m). View is from the periphery of the receptor toward the pore axis. Cholesterol at the interface is also shown in yellow in d, i and k. Cartoon pentagons (bottom) are colored to illustrate all subunits composing the displayed interface; subunits not participating in the displayed interface are grey. Principal (+) and complementary (-) sides of the displayed interface are labeled on each pentagon. n, Analysis of the subunit interfaces of both conformations using PDBePISA server69.