. 2018 Jul 4;7(6):1108–1119. doi: 10.1039/c8tx00068a

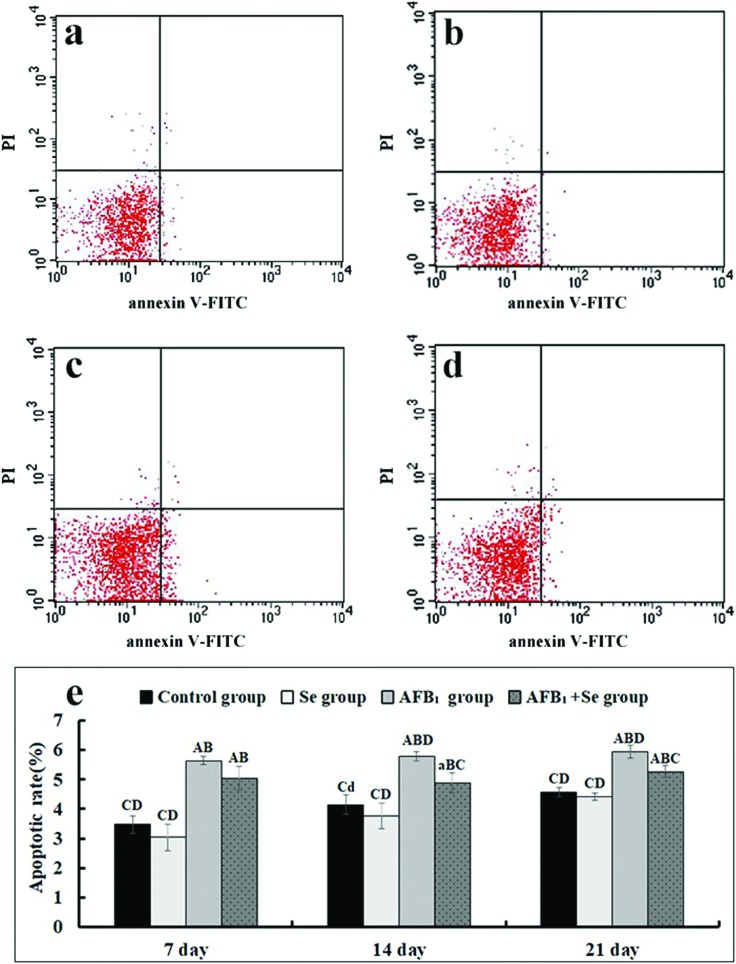
Fig. 5. The jejunal cell apoptosis by flow cytometry assay. (a–e) The representative scattergram of apoptotic jejunal cells obtained by flow cytometry assay in the control group (a), Se group (b), AFB1 group (c) and AFB1 + Se group (d) at 21 days of age; (e) apoptotic rates by flow cytometry assay. Note: Data are presented with the means ± standard deviation (n = 6). Letters A, B, C and D represent the significant difference (p < 0.01) between the group and control group, Se group, AFB1 group, and AFB1 + Se group, respectively. Letters a, b, c, and d represent the difference (p < 0.05) between the group and control group, Se group, AFB1 group, and AFB1 + Se group, respectively.

Fig. 5