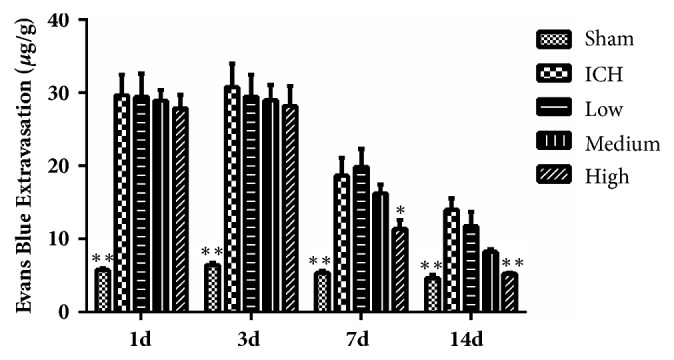
Figure 3.

Results of Evans blue extravasation in each group at different time points. Data were presented as mean ± SEM, n=5 rats for each group. ∗ P<0.05; ∗∗ <0.01 compared with ICH group.

Results of Evans blue extravasation in each group at different time points. Data were presented as mean ± SEM, n=5 rats for each group. ∗ P<0.05; ∗∗ <0.01 compared with ICH group.