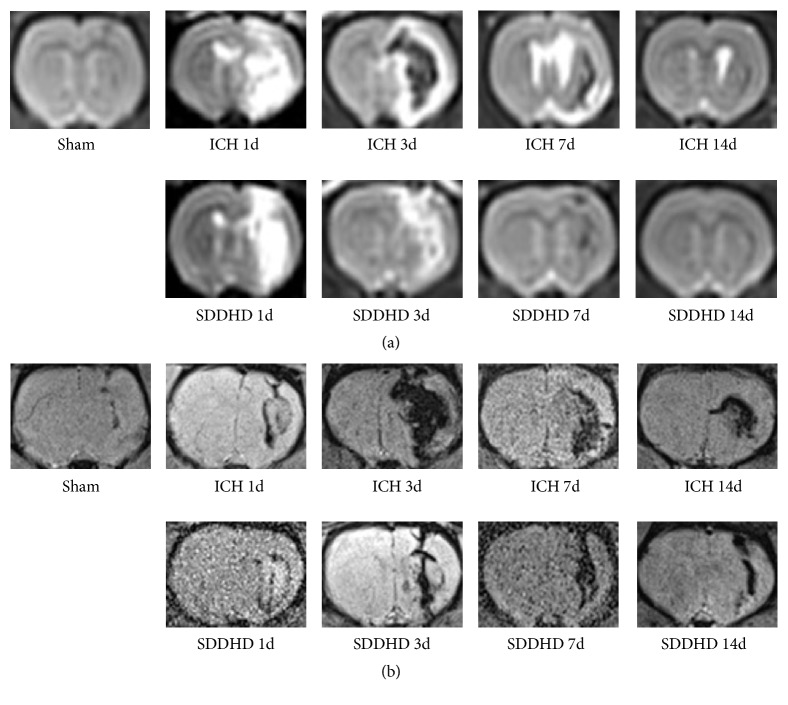
Figure 4.
Results of MRI study. The images, taken at the different time points, were from a single rat. (a) Representative T2-weighted MR images of intracerebral hematoma in rat brain at the level of the collagenase injection. (b) Representative SWI images of intracerebral hematoma in rat brains surrounding collagenase injection. n=5 rats for each group at each time point. The images were from different rats in the same group.

