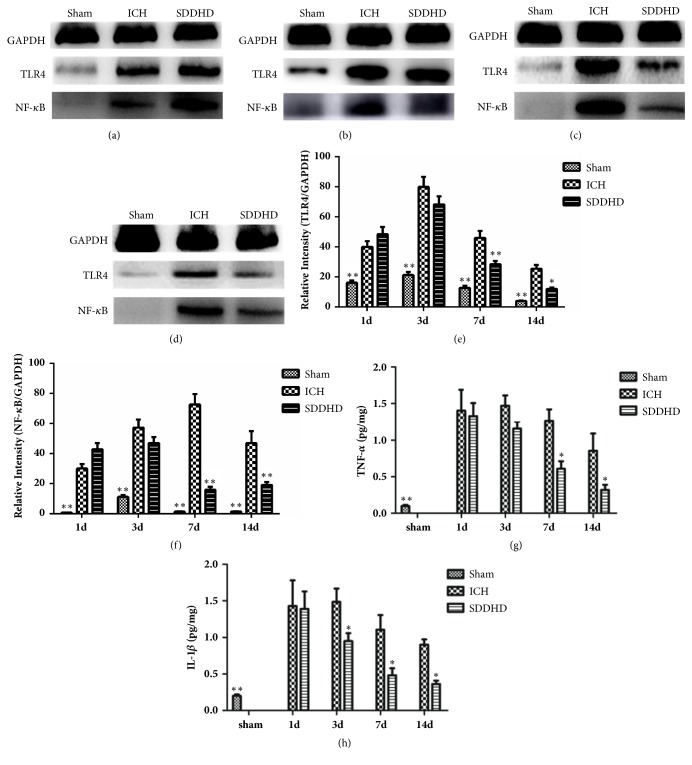
Figure 6.
Detection of TLR4 and NF-κB in the hemorrhagic area using Western blotting. (a) The bands of GAPDH, TLR4, and NF-κB at 1 day. (b) The bands of GAPDH, TLR4, and NF-κB at 3 days. (c) The bands of GAPDH, TLR4, and NF-κB at 7 days. (d) The bands of GAPDH, TLR4, and NF-κB at 14 days. (e) Quantitative results of the bands for TLR4 relative to GAPDH at each time point. (f) Quantitative results of the bands for NF-κB relative to GAPDH at each time point. Data are presented as mean ± SEM, n=5 rats for each group. ∗ P<0.05; ∗∗ <0.01 compared with ICH group. Results of TNF-α (g) and IL-1β (h) concentrations in each group at different time points. Data were presented as mean ± SEM, n=5 rats for each group. ∗ P<0.05; ∗∗ <0.01 compared with ICH group∗.

