
Figure 2.
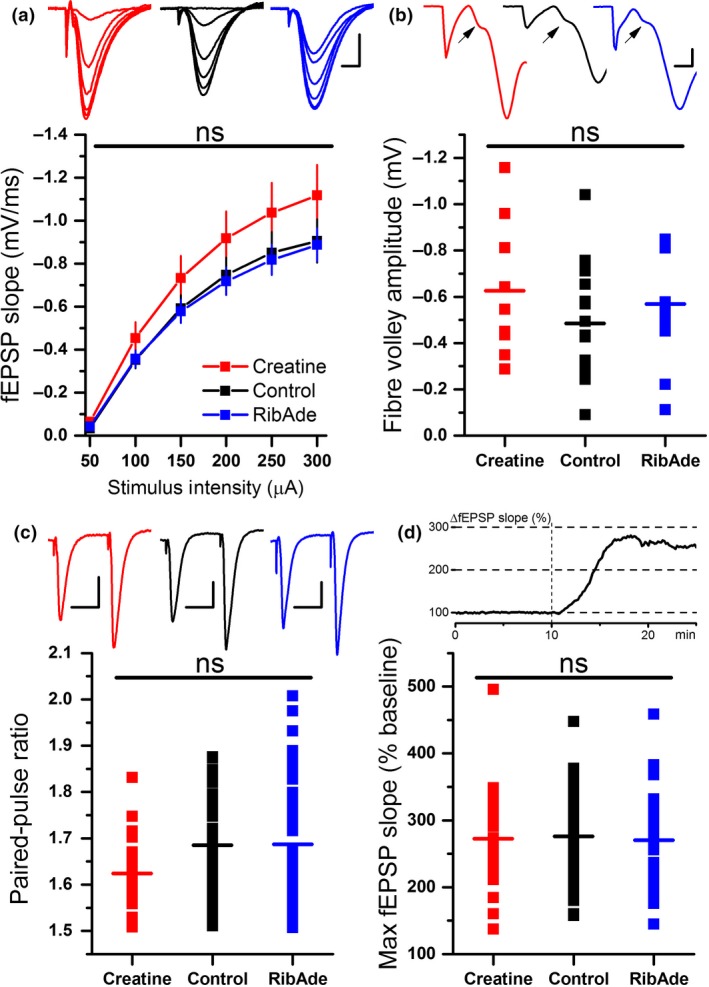
Influence of RibAde and creatine on excitatory synaptic transmission. (a) Input‐output curves of field excitatory post‐synaptic potential (fEPSP) slope versus stimulus strength (mean ± SEM) for control (black line and symbols; n = 56 slices) and creatine‐ (red; n = 28 slices) and RibAde‐treated slices (blue; n = 47 slices). Inset are representative fEPSPs at increasing stimulus strengths from each of the three conditions and colour‐coded as per the graph. There was no main effect of treatment on the input‐output curves (ns; p = 0.275) Scale bars measure 0.5 mV and 5 ms. (b) No significant difference (ns; p = 0.400) was observed in the pre‐synaptic fibre volley (measured at 300 μA stimulus strength; data from 9 to 17 slices) across the three conditions. The graph plots individual fibre volley amplitude for each experiment and condition with the mean for each depicted as a horizontal bar. Inset traces show representative fibre volleys indicated by an arrow and colour‐coded as per the graph. fEPSPs have been truncated at 5 ms after the onset of electrical stimulation (first downward deflection for each trace) and show the positive‐going population spike occasionally evoked at high (300 μA) stimulus strengths. Scale bar measures 0.5 mV and 1 ms. (c) Paired‐pulse facilitation was not influenced by RibAde or creatine (p = 0.088). The graph plots individual paired‐pulse ratios (50 ms inter‐pulse interval; n = 22–47 slices) for each experiment and condition with the mean for each depicted as a horizontal bar. Inset is the representative fEPSPs, evoked at 50 ms intervals, colour‐coded as per the graph. Scale bars measure 0.5 mV and 25 ms. (d) The enhancement of synaptic transmission caused by removal of Mg2+ from the artificial cerebrospinal fluid (aCSF) was not different in creatine‐ or RibAde‐treated slices compared to control slices (p = 0.927). The graph plots the maximal enhancement of the fEPSP after 15 min exposure to nominally Mg2+‐free aCSF (n = 19–51 slices) for each experiment and condition, with the mean for each depicted as a horizontal bar. Inset is a representative experiment showing the enhancement of the fEPSP (as a percentage of baseline) after removal of Mg2+ from the aCSF, which occurred at t = 10 min (broken vertical line).