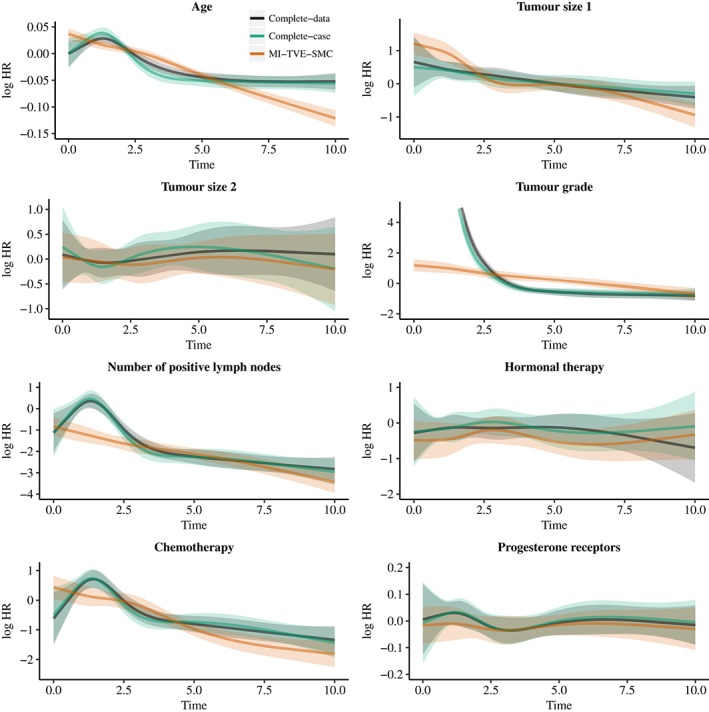
Figure 5.

Results from the Rotterdam Breast Cancer Study. Plots showing estimated log hazard ratios as a function of time from a complete‐data analysis, complete‐case analysis, and MI‐TVE‐SMC analysis. The time‐varying effects for all covariates were modelled using a restricted cubic spline with 5 knots. Shaded errors show 95% confidence intervals. Results are shown up to time 10. MI, multiple imputation; SMC, substantive‐model‐compatible; TVE, time‐varying effect [Colour figure can be viewed at http://wileyonlinelibrary.com]
