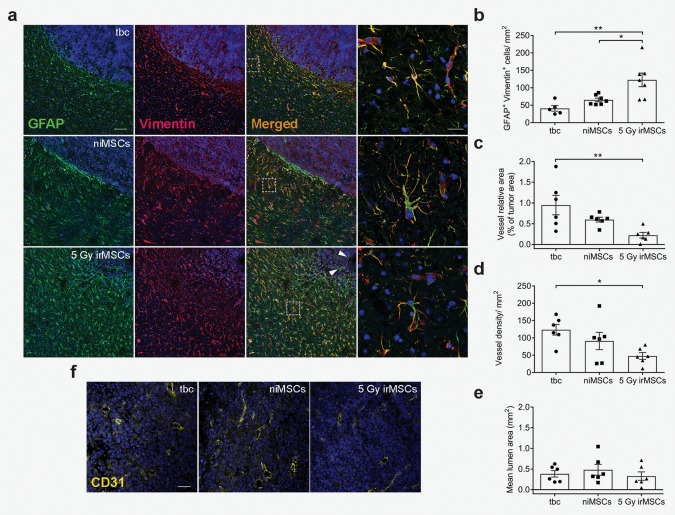
Figure 3.

Tumor microenvironment is affected by irMSCs. (a) Representative images of reactive astrocytes (GFAP+ green, Vimentin+ red) at the tumor border, double positive cells quantified in (b); scale bar 100 µm and 20 µm for low and high (inserts) magnification images, respectively. Data are from two independent experiments (n = 5–7, all experimental groups assessed in parallel in each independent experiment) and are presented as mean ± SEM. (f) Representative images showing effect of 5 Gy irMSCs on tumor vasculature (CD31+, yellow), quantified in (c), (d), and (e); scale bar 50 µm. Data are from two independent experiments (n = 6, all experimental groups assessed in parallel in each independent experiment) and are presented as mean ± SEM. Comparisons between groups are performed by one‐way ANOVA, followed by Tukey's multiple comparisons test; *p < 0.05, **p < 0.01.
