Figure 4.

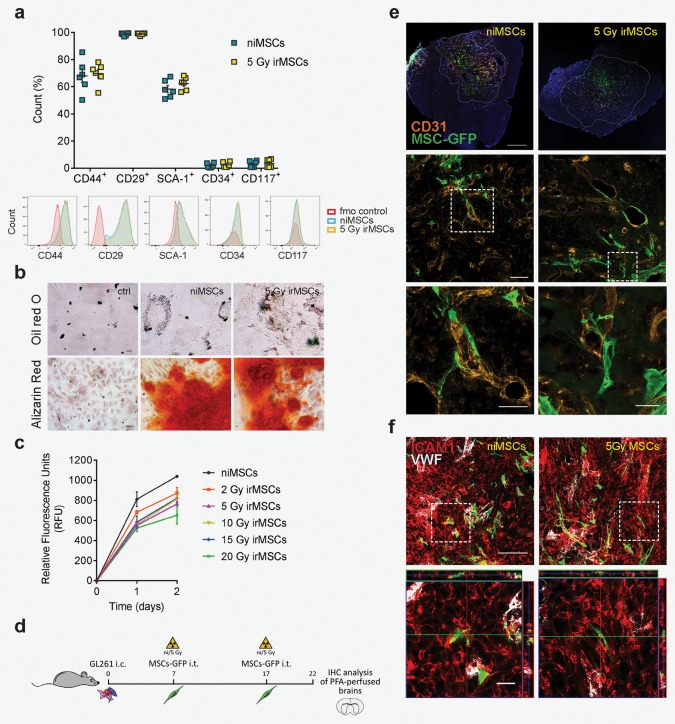
MSC basic characteristics are not affected by low‐dose irradiation in vitro or in vivo. (a) Flow cytometry analysis of MSC surface markers expression at 24 hr post‐irradiation (5 Gy); data from two independent experiments are shown as mean ± SEM (n = 6). (b) Differentiation potential as assessed by immunofluorescence (IF) for adipocyte (Oil red O) and osteoblast (Alizarin red) marker expression in niMSCs and 5 Gy irMSCs; scale bar 20 and 50 µm, respectively. (c) Proliferation capacity of MSCs after various radiation doses assessed at 24 and 48 hr by Presto Blue assay; data from two independent experiments are presented as mean ± SEM. (from d to f) Evaluation of irMSC in vivo tumor‐tropism. (d) ni/5 Gy irMSCs‐GFP were transplanted i.t. at days 7 and 17, after GL261 mouse GBM inoculation and animals were sacrificed by transcardiac perfusion at Day 22. (e) Representative images showing in vivo tumor‐ and peri‐vascular tropism of MSCs (CD31+ orange, GFP+ green, dashed lines marking tumor edges); scale bars from top to bottom: 500, 100, 50 (high magnification, left panel), and 25 (high magnification, right panel) µm. (f) Representative images of MSC (GFP+ green)‐tumor (ICAM1+ red) interaction in vivo; von Willebrand factor (VWF white) expression distinguishes endothelial cells from tumor cells; scale bar 100 µm and 20 µm for low and high magnification, respectively.
