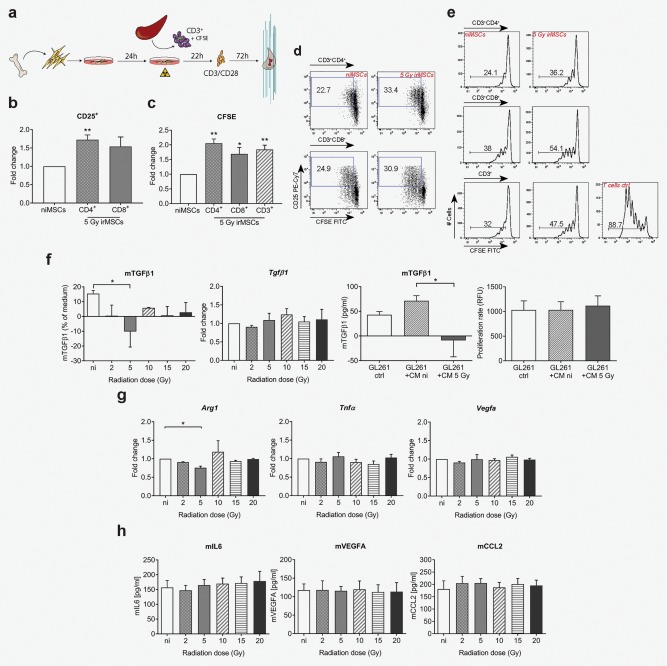
Figure 5.

MSC inherent immune suppressive features are reduced after low‐dose irradiation and affect immune suppressive properties of tumor cells in vitro. (from a to e) T cell activation assay. ni/irMSCs were co‐cultured with splenic CD3+ T cells (1:32 ratio) and after 22 hr, cultures were supplemented with CD3/CD28 mouse T‐activator beads and analyzed 72 hr later by flow cytometry (see outline in a). (b) Fold change expression of CD25 in the CD3+CD4+ and CD3+CD8+ T cell population and representative plots (d). (c) Cell proliferation was followed in CD3+CD4+, CD3+CD8+ and total CD3+ T cell population using CFSE and expressed as fold change; representative histograms are shown in (e). Data are from one experiment with three biological replicates (n = 3) and are presented as mean ± SEM. Comparisons between groups are performed by two‐tailed Student's t test. (f) TGFβ1 analyses at 8 hr post‐irradiation; protein (first panel) and gene expression (second panel) analyses of TGFβ1 in ni/irMSCs; TGFβ1 protein analysis (third panel) and proliferation (forth panel) of GL261 cells cultured for 12 hr in ni/irMSC conditioned medium (8 hr). (g) Gene expression analysis of MSCs at 8 hr post‐irradiation; ‐fold change expression of Arg1, Vegfa and Tnfα compared to Gapdh. (h) Factors released by MSCs at 8 hr post‐irradiation, as assessed by ELISA. Data shown are from 2 to 5 biological replicates, with technical replicates, and are presented as mean ± SEM. Comparisons between groups are performed by one‐way ANOVA, followed by Tukey's multiple comparisons test. *p < 0.05, **p < 0.01.
