
Figure 4.
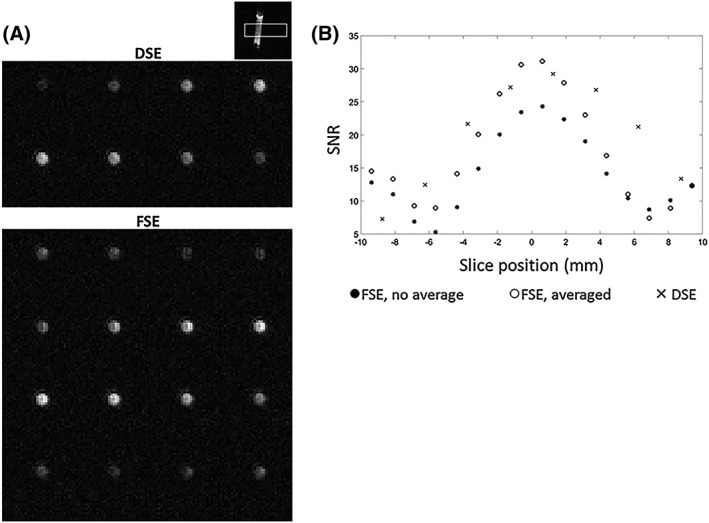
A, Images acquired with the DSE and FSE‐II pulse sequences from a cylindrical phantom containing 5 M [1‐13C] lactate at thermal equilibrium. B, Signal from the first four echoes in the FSE‐II pulse sequence (equivalent to the FSE‐I pulse sequence) and signal obtained by averaging the signal from the first four echoes with the last four echoes in the FSE‐II pulse sequence