Figure 4.

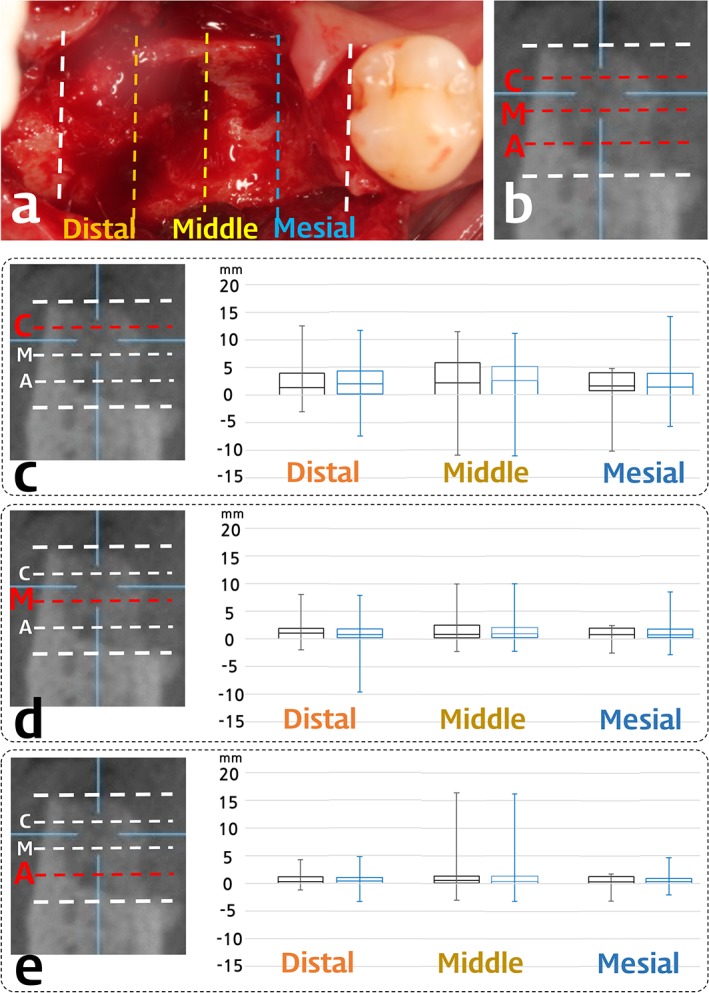
Box plots of the horizontal width reduction of the DBBM (black) and the DPBM group (blue). Box plot revealed the first and the third quartiles, median, and maximum/minimum of the data. C, coronal; M, middle; A, apical level

Box plots of the horizontal width reduction of the DBBM (black) and the DPBM group (blue). Box plot revealed the first and the third quartiles, median, and maximum/minimum of the data. C, coronal; M, middle; A, apical level