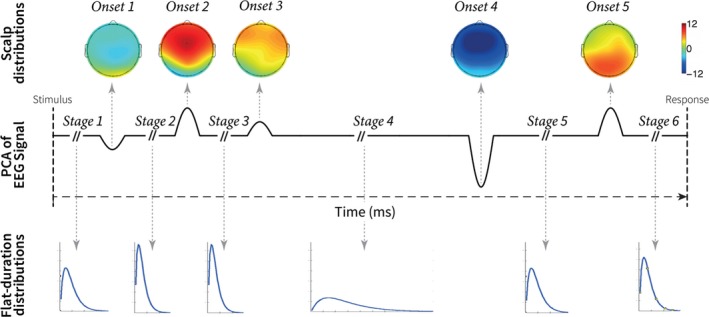
Figure 2.

Schematic representation of the process underlying all trials estimated by the HSMM‐MVPA method. The solid black line represents the model of one principal component of one EEG trial. This model combines six stages with a mean of zero and five onsets of 50 msec long. The topographical EEG maps on the top are the amplitude of the deflections at the onsets estimated by the HSMM‐MVPA. The blue lines at the bottom represent the gamma distributions estimated by the HSMM‐MVPA. The gamma distributions determine the duration of the stages. This figure has been adapted with permission from Anderson et al. (2016). PCA stands for principal component analysis. EEG stands for electroencephalogram.
