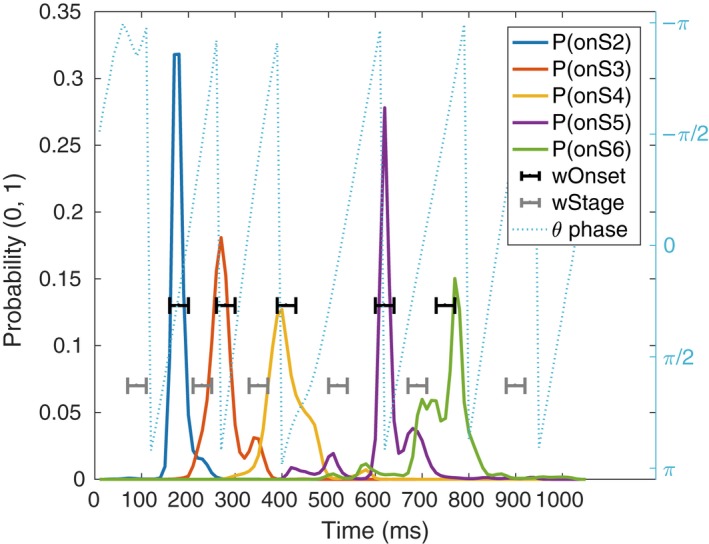
Figure 3.

Example of one trial EEG phase (dotted, light blue), the probability distributions for the location of cognitive stages' onsets (solid lines), and the analysis windows of relevant cognitive events (brackets). The blue‐dashed line is the theta band phase during a trial in one electrode. The solid lines are the probability distributions given by the MVPA‐HSMM methods regarding the location of the onset of cognitive stages (P(onSX)). Black indicators (wOnset) show the five‐sample windows around the expected location of each onset. Similarly, gray indicators show the five‐sample windows that define the respective stages (wStage). These time windows are used to compute Power, ITPC, and dwPLI.
