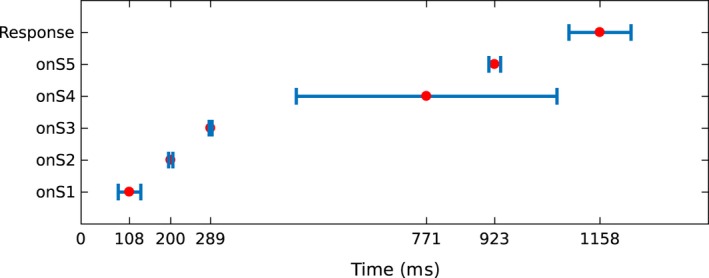
Figure 4.

Temporal location of stage onsets in a trial. The red dot represents the mean onset location across trials and subjects. The blue bars represent the standard deviation on the location of the onset. Y‐axis labels the onset to which the red dot and standard deviation belong (onS1: onset of stage one).
