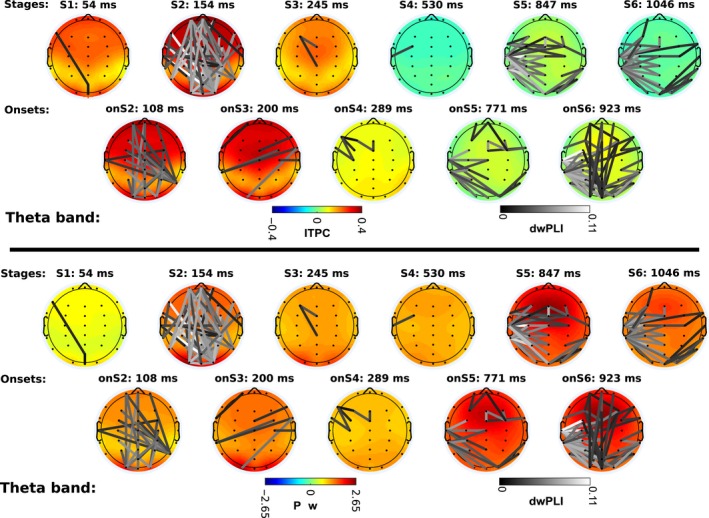
Figure 5.

Theta band power, phase locking (ITPC: intertrial phase clustering), and phase connectivity (dwPLI: de‐biased weighted phase‐lag index). Lower panel shows the scalp profiles of grand‐averaged power across trials and subjects z‐scored respect to baseline. Upper panel shows the scalp profiles of grand‐averaged ITPC values subtracted from baseline values. dwPLI connectivity edges are superimposed on the scalp profiles on gray color scale. The color of edges depicts connectivity strength. Black color represents the lowest connectivity strength above the connectivity significance threshold; white color is the highest observed connectivity strength. dwPLI edges are the same in both panels. The mean temporal location of each scalp map is denoted on top of the map (e.g., S1: 54 ms: The stage one lays on average 54 millisecond after the onset of the trial).
